September 2, 2026 | U.S. Value Equity
Small-Cap Value: The AI Pivot's Overlooked Winner?

Portfolio Manager

Portfolio Specialist, Research Coordinator

Research Associate
September 2, 2026 | U.S. Value Equity
Portfolio Manager
Portfolio Specialist, Research Coordinator
Research Associate
View Fund:
https://im.williamblair.com/investments/mutual-funds/icscx-small-cap-value-fund
View Fund:
https://im.williamblair.com/investments/mutual-funds/ismvx-small-mid-cap-value-fund
View Fund:
https://im.williamblair.com/investments/mutual-funds/wvmix-mid-cap-value-fund

For much of the current AI cycle, the market’s enthusiasm centered on a handful of large-cap hyperscalers (Amazon, Google, Meta, and Microsoft), which were viewed as the primary beneficiaries of the AI buildout. However, the market began to call into question the return on capital related to AI-specific expenditures.
While the ultimate payoff for hyperscalers remained uncertain, one thing appeared to be clear: the massive amount of capex spend on AI was here to stay. And that reality sparked a rotation. Investors began repositioning away from large-cap cloud providers and toward the picks and shovels of the AI goldrush—the semiconductor and technology hardware companies actually building the infrastructure.
For small-cap investors, this was a notable moment of good fortune: much of the semiconductor and technology hardware exposure needed to capture this shift resided squarely in the Russell 2000 Value Index.[1]
The results were dramatic. During the second quarter of 2026, small-cap value semiconductor and electronic equipment stocks surged roughly 100% and 90%, respectively—a powerful validation of the capex-beneficiary thesis.
But more recently, that trade has begun to unwind, and the timing is telling. The pullback in small-cap tech performance coincided with the Russell index reconstitution in July, which saw the small-cap value information technology sector shed approximately 500 basis points of overall exposure.
The result: the Russell 2000 Value Index now carries the lowest overall technology exposure of any Russell index. Perhaps even more notable, the index has moved to a negative correlation with semiconductor stocks—a meaningful shift in its risk profile from where it started the year.
In other words, just as sentiment around AI-adjacent small caps has cooled, the benchmark itself has mechanically shed much of the exposure that drove the runup in the first place.
This index-level shift creates a distinct opportunity for active small-cap value managers. With the Russell 2000 Value Index now structurally underweight technology relative to peer indices (and negatively correlated to semiconductors), a manager benchmarked to it (as we are) is well positioned to offer investors a hedge against potentially lofty AI-related valuations. Additionally, a small-cap value manager that is focused on quality and has exposure to more cyclical end-markets is able to participate in what we see as a broadening market with multiple supportive tailwinds.
For investors concerned about concentration risk in AI-exposed names, the Russell 2000 Value Index stands out as a differentiated outlier.
The technology weighting gap is stark when viewed across the Russell family, As of June 30, 2026, the Russell 2000 Value Index sat at roughly 8% technology exposure, compared with 11.9% for the Russell 2000 Index, 17.5% for the Russell 1000 Value Index, and materially higher weights still for the Russell 1000 Index, Russell 3000 Index, and Russell 1000 Growth Index—the latter approaching 66%. Even the S&P 500 Index, at roughly 36% technology exposure on a comparable basis, dwarfs the Russell 2000 Value Index’s weighting.
For investors concerned about concentration risk in AI-exposed names, the Russell 2000 Value Index stands out as a differentiated outlier.
Beyond the index mechanics, we see encouraging signs in the broader macro backdrop. Since 2021, the domestic economy has been notably directionless compared to prior cycles, and small caps—historically sensitive to shifts in manufacturing activity—have lacked a clear catalyst.
That may be changing. Small caps have shown a high degree of correlation with the ISM Manufacturing Purchasing Managers’ Index (PMI),[2] which is now finally moving into expansion territory after an unusually prolonged stretch of contraction. That’s among the longest such durations on record.
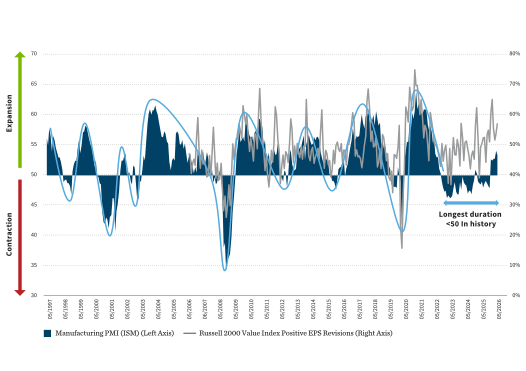
Sources: FactSet and William Blair, as of 6/30/2026. Past performance is not indicative of future returns. Index performance is provided for illustrative purposes only. Indices are unmanaged, do not incur fees or expenses, and cannot be invested in directly.
This isn’t an isolated data point. Transportation equities, often viewed as a real-economy bellwether, have tracked closely with ISM manufacturing new orders, and both have been trending higher.
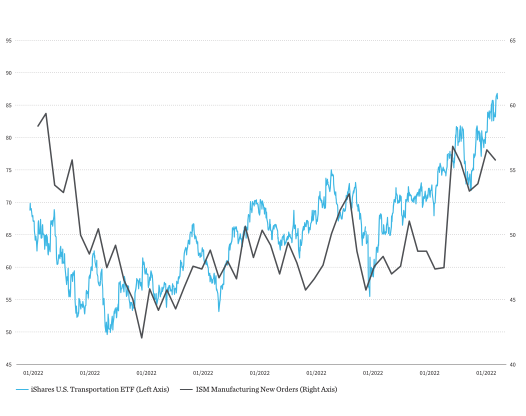
Sources: FactSet, Piper Sandler, and William Blair, as of 6/30/2026. Past performance is not indicative of future returns. References to specific securities and their issuers are for illustrative purposes only and should not be construed as investment advice or a recommendation to buy or sell any security.
Lending conditions tell a similar story: ISM manufacturing new orders have moved in tandem with easing senior loan officer lending standards, suggesting the credit backdrop is becoming more supportive of the kind of industrial and manufacturing activity that tends to benefit small cap companies disproportionately.
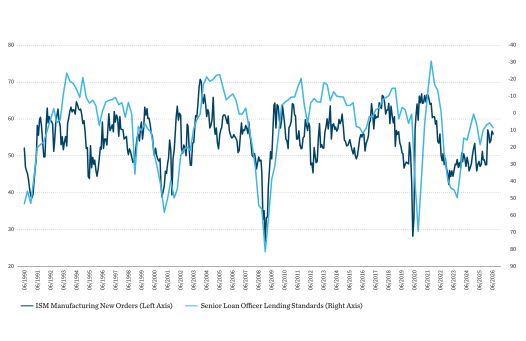
Sources: FactSet, Piper Sandler, and William Blair, as of 6/30/2026. The Federal Reserve System's Senior Loan Officer Opinion Survey on Bank Lending Practices provides qualitative and limited quantitative information on bank credit availability and loan demand, as well as on evolving developments and lending practices in the U.S. loan markets. This series measures the net percentage of domestic banks tightening standards for loans.
Taken together, these indicators suggest that the macro fog that has weighed on small caps since the pandemic may be starting to lift, and small caps may finally have a real fundamental tailwind rather than just a narrow, capex-driven rally.
Perhaps the most compelling argument is a historical one. If we are entering a cycle where small caps begin to sustainably outperform large caps, history suggests we may still be in the very early stages.
Looking at the Russell 2000 Value Index’s price history, the index has spent recent years working through a long stretch of directionless volatility—cooling economic hopes, surging inflation, aggressive U.S. Federal Reserve hikes, banking stress, and swings in expectations around interest rate cuts have all buffeted performance without producing a clear trend. Only recently has the index begun to find its footing, coinciding with the broadening-out narrative and renewed enthusiasm around AI-capex beneficiaries.
Zooming out further, the Russell 2000 Index/Russell 1000 Index[3] price-to-book ratio—a long-term proxy for small-cap valuation relative to large cap—remains historically depressed. Despite small caps’ recent bout of outperformance, the asset class still has substantial ground to recover relative to prior cycles, including the stretch following the tech bubble and the post-financial-crisis recovery, both periods when small caps meaningfully outpaced their large-cap counterparts for extended periods.
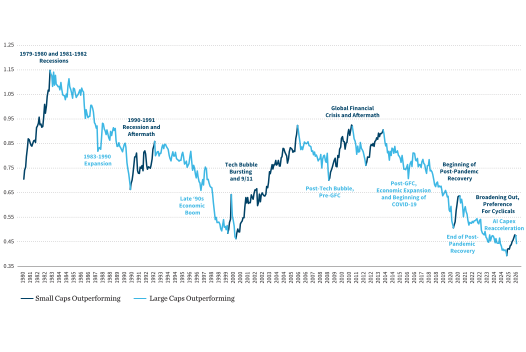
Sources: Bank of America and William Blair, as of 6/30/2026. Past performance is not indicative of future returns. Index performance is provided for illustrative purposes only. Indices are unmanaged, do not incur fees or expenses, and cannot be invested in directly. Small caps are represented by the Russell 2000 Index, large caps by the Russell 1000 Index.
The story of 2026 so far has been one of rotation: first from hyperscalers to semis, then from broad AI enthusiasm into a more discerning, capex-driven trade, and now into an index dynamic that we believe deserves more attention.
The Russell 2000 Value Index’s reduced technology exposure, achieved not through active positioning but mechanical reconstitution, has left it structurally different from every other major Russell benchmark at a moment when AI valuation concerns remain front and center.
Combine that with early signs of a genuine macro inflection—an expanding ISM Manufacturing PMI, resilient transportation equities, and easing lending standards—and a historical valuation gap between small and large caps that remains wide by any long-term measure, and we believe the setup for small-cap value looks more interesting than the recent pullback might suggest.
If the cycle turns in small caps’ favor, we believe the fundamentals argue this could be closer to the first inning than the ninth.
Mark Goodman, CFA, is a portfolio manager on William Blair's U.S. value equity team.
Greg Czarnecki is a portfolio specialist and research coordinator on William Blair’s U.S. value equity team.
Jack Sequerth is an associate portfolio specialist on William Blair's U.S. value equity team.
[1] The Russell 2000 Value Index measures the performance of U.S. small-cap companies within the Russell 2000 Index that exhibit relatively lower price-to-book ratios and lower expected growth characteristics. [2] The ISM Manufacturing Purchasing Managers' Index (PMI) is a widely followed measure of U.S. manufacturing activity published by the Institute for Supply Management. A reading above 50 indicates expansion in manufacturing activity, while a reading below 50 indicates contraction. [3] The Russell 1000 Index measures the performance of the large-cap segment of the U.S. equity market and includes approximately 1,000 of the largest U.S. companies by market capitalization. The Russell 2000 Index measures the performance of the small-cap segment of the U.S. equity market and includes approximately 2,000 of the smallest companies in the Russell 3000 Index.
View Strategy:
https://im.williamblair.com/investments/separate-accounts/small-cap-value
View Strategy:
https://im.williamblair.com/investments/separate-accounts/small-mid-cap-value
View Strategy:
https://im.williamblair.com/investments/separate-accounts/mid-cap-value
Want the latest insights on the economy and other forces shaping the investment landscape?
Subscribe to our Investing Insights newsletter.
Any investment or strategy mentioned herein may not be appropriate for every investor. There can be no assurance that investment objectives will be met. Products and services listed are available only to residents of this jurisdiction and may only be available to certain categories of investors. The information on this website does not constitute an offer for products or services, or a solicitation of an offer to any persons outside of this jurisdiction who are prohibited from receiving such information under applicable laws and regulations. Nothing on this webpage should be construed as advice and is therefore not a recommendation to buy or sell shares.
Please carefully consider the Funds’ investment objectives, risks, charges, and expenses before investing. This and other information is contained in the Funds’ prospectus and summary prospectus, which you may obtain by calling 1-800-742-7272. Read the prospectus and summary prospectus carefully before investing. Investing includes the risk of loss.
The William Blair Funds and William Blair ETFs are distributed by William Blair & Company, L.L.C., member FINRA/SIPC.
The William Blair SICAV is a Luxembourg investment company with variable capital registered with the Commission de Surveillance du Secteur Financier (“CSSF”) which qualifies as an undertaking for collective investment in transferable securities (“UCITS”). The Management Company of the SICAV has appointed William Blair Investment Management, LLC as the investment manager for the fund.
Please carefully consider the investment objectives, risks, charges, and expenses of the William Blair SICAV. This and other important information is contained in the prospectus and Key Investor Information Document (KIID). Read these documents carefully before investing. The information contained on this website is not a substitute for those documents or for professional external advice.
Information and opinions expressed are those of the authors and may not reflect the opinions of other investment teams within William Blair Investment Management, LLC, or affiliates. Factual information has been taken from sources we believe to be reliable, but its accuracy, completeness or interpretation cannot be guaranteed. Information is current as of the date appearing in this material only and subject to change without notice. Statements concerning financial market trends are based on current market conditions, which will fluctuate. This material may include estimates, outlooks, projections, and other forward-looking statements. Due to a variety of factors, actual events may differ significantly from those presented.
Investing involves risks, including the possible loss of principal. Equity securities may decline in value due to both real and perceived general market, economic, and industry conditions. The securities of smaller companies may be more volatile and less liquid than securities of larger companies. Investing in foreign denominated and/or domiciled securities may involve heightened risk due to currency fluctuations, and economic and political risks. These risks may be enhanced in emerging markets and frontier markets. Investing in the bond market is subject to certain risks including market, interest rate, issuer, credit, and inflation risk. High-yield, lower-rated, securities involve greater risk than higher-rated securities. Different investment styles may shift in and out of favor depending on market conditions. Diversification does not ensure against loss.
Past performance is not indicative of future returns. References to specific companies are for illustrative purposes only and should not be construed as investment advice or a recommendation to buy or sell any security.
William Blair Investment Management, LLC is an investment adviser registered with the U.S. Securities and Exchange Commission.
Issued in the United Kingdom by William Blair International, Ltd., authorized and regulated by the Financial Conduct Authority (FCA), and is only directed at and is only made available to persons falling within articles 19, 38, 47, and 49 of the Financial Services and Markets Act of 2000 (Financial Promotion) Order 2005 (all such persons being referred to as "relevant persons").
Issued in the European Economic Area (EEA) by William Blair B.V., authorized and supervised by the Dutch Authority for the Financial Markets (AFM) under license number 14006134 and also supervised by the Dutch Central Bank (DNB), registered at the Dutch Chamber of Commerce under number 82375682 and has its statutory seat in Amsterdam, the Netherlands. This material is only intended for eligible counterparties and professional clients.
Issued in Switzerland by William Blair Investment Services (Zurich) GmbH, Talstrasse 65, 8001 Zurich, Switzerland ("WBIS"). WBIS is engaged in the offering of collective investment schemes and renders further, non-regulated services in the financial sector. WBIS is affiliated with FINOS Finanzomubdsstelle Schweiz, a recognized ombudsman office where clients may initiate mediation proceedings pursuant to articles 74 et seq. of the Swiss Financial Services Act ("FinSA"). The client advisers of WBIS are registered with regservices.ch by BX Swiss AG, a client adviser registration body authorized by the Swiss Financial Market Supervisory Authority ("FINMA"). WBIS is not supervised by FINMA or any other supervisory authority or self-regulatory organization. This material is only intended for institutional and professional clients pursuant to article 4(3) to (5) FinSA.
Issued in Australia by William Blair Investment Management, LLC (“William Blair”), which is exempt from the requirement to hold an Australian financial services license under Australia's Corporations Act 2001 (Cth). William Blair is registered as an investment advisor with the U.S. Securities and Exchange Commission (“SEC”) and regulated by the SEC under the U.S. Investment Advisers Act of 1940, which differs from Australian laws. This material is intended only for wholesale clients.
Issued in Singapore by William Blair International (Singapore) Pte. Ltd. (Registration Number 201943312R), which is regulated by the Monetary Authority of Singapore under a Capital Markets Services License to conduct fund management activities. This material is intended only for institutional investors and may not be distributed to retail investors.
Issued in Canada by William Blair Investment Management, LLC, which relies on the international adviser exemption, pursuant to section 8.26 of National Instrument 31-103 in Canada.


The content contained in this site is intended as informational or educational in nature and does not constitute investment advice or a recommendation of any investment strategy or product for a particular investor. Investment advice and recommendations can be provided only after careful consideration of an investor’s objectives, guidelines, and restrictions. Investors should consult a financial professional/financial consultant or investment adviser before making any investment decisions. Investing includes the risk of loss.
Copyright © 2026 William Blair. William Blair is a registered trademark of William Blair & Company, L.L.C. “William Blair” refers to William Blair Investment Management, LLC and affiliates.

