Emerging markets (EM) corporate credit demonstrated robust performance in 2024, with index returns exceeding 7.6%. This strong showing surpassed returns in both EM and developed market (DM) credit across all rating categories, except for CCC-rated bonds.
As we look ahead to 2025, several key themes are likely to influence the performance of EM corporate debt: negative net supply, U.S. policies, crude oil markets, interest rates and financing costs, and improved default rates.
Negative Net Supply: A Shift in Issuance Trends
The 2010s were marked by rapid growth in the EM corporate debt universe, with the number of issuers increasing from 269 to 845. The market cap of EM corporate debt expanded from $300 billion to $1.4 trillion during this period, largely driven by Asia, particularly China.
Since 2021, however, the dynamics of issuance have changed.
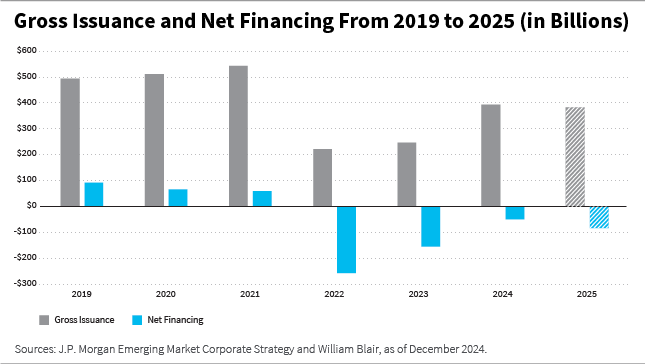
Gross issuance of EM corporate debt peaked in 2021 but has since declined. As a result, net financing—which accounts for gross issuance minus coupons, amortizations, tenders, and buybacks—turned deeply negative in 2022 and 2023.
While issuance rebounded slightly in 2024 and is expected to stabilize in 2025, net financing is likely to remain negative, albeit at reduced levels. In addition, local debt financing and private credit markets have provided alternative funding sources for issuers, reducing the need to access public hard currency markets.
The decline in new issuance has had notable effects. Portfolios have become more stable, trading liquidity has been reduced, and demand surges have triggered technical rallies as market participants seek limited available bonds.
A healthy issuance market is critical for the functioning and pricing of corporate credit, and gross issuance projections for 2025 are still likely to lead to negative net financing.
U.S. Policies: Tariffs, Trade, and Currency Volatility
The policies of the Trump 2.0 administration are expected to play a significant role in shaping the EM corporate debt landscape. Trade policies, including potential tariffs on China and a softer outlook for EM currencies, are key risks for the asset class. Tariffs could directly impact certain sectors, while currency depreciation poses more diverse risks to issuers.
We define Greater China as China, Hong Kong, and Macau, which collectively represent about 15% of the J.P. Morgan Corporate Emerging Markets Bond Index (CEMBI) Broad Diversified[1], with financials, consumer, and technology sectors dominating the composition.
While tariffs on Chinese goods may influence market perception, the predominantly investment-grade (IG) nature of these sectors suggests resilience.
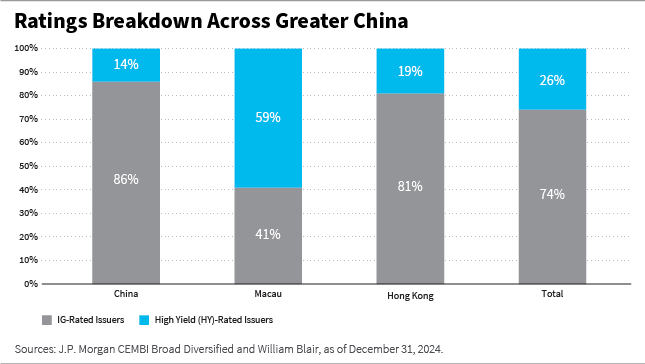
For example, the financials sector, which account for more than 40% of the Greater China CEMBI composition, are well-capitalized and systemic in importance. In addition, gaming issuers in Macau, part of the consumer sector, have shown improved credit quality due to strong demand and deleveraging and have a less direct transmission mechanism due to tariffs.
Meanwhile, the technology sector, which consists of 98% IG-rated issuers, is also largely domestically focused and capable of absorbing external volatility. But the embattled real estate sector’s outlook, in our view, is more tied to government support policies than external dynamics at this point.
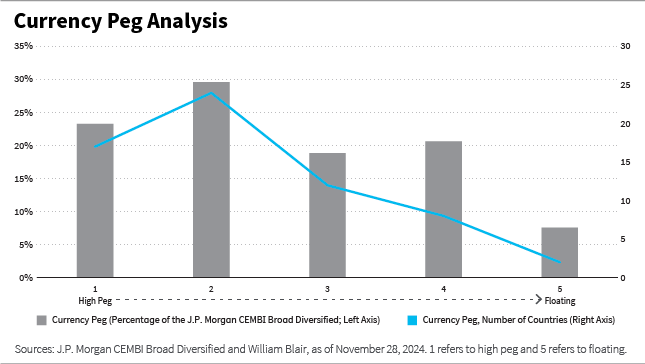
Currency volatility, heightened by the U.S. election and subsequent policy shifts, has spread from DM to EM currencies. A significant portion of EM corporate debt is tied to countries with currency pegs or interventionist central banks, mitigating apparent currency depreciations.
Moreover, many issuers in commodity-linked sectors, such as oil and gas, benefit from dollar-denominated revenues, providing further insulation. Bottom-up analysis will likely remain essential to assess individual issuer risks, as local currency-denominated debt can introduce mismatches despite broader protective measures.
Crude Oil: Balancing Demand, Supply, and Geopolitics
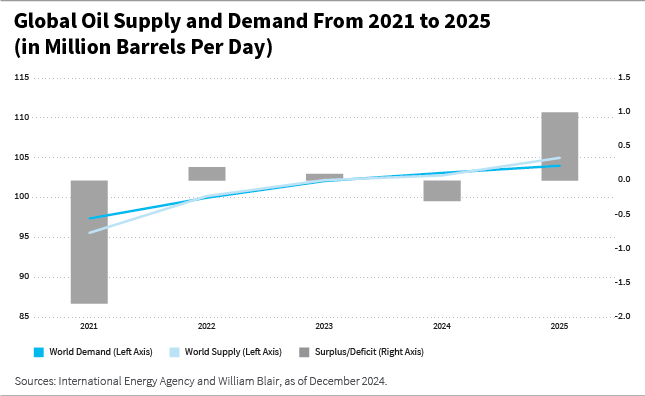
Crude oil markets are poised for a year of uncertainty in 2025, shaped by evolving demand patterns, supply dynamics, and geopolitical tensions. Global demand growth is forecast at approximately 1 million barrels per day, slightly below historical averages.
While India and the Middle East are becoming larger consumers, China and the United States remain the primary drivers of demand. China’s demand growth is expected to remain subdued due to economic challenges and the increasing penetration of electric vehicles (EVs). And in the United States, oil intensity and consumption growth have plateaued, although new policies could introduce volatility.
On the supply side, non-Organization of the Petroleum Exporting Countries (OPEC) production is set to grow, particularly in countries like Brazil, Guyana, Canada, and the United States. However, OPEC’s output decisions and the potential release of additional barrels add uncertainty to the supply outlook.
In addition, geopolitical factors, including conflicts in the Middle East and Ukraine, as well as U.S. policies toward Iran, Venezuela, and Russia, will likely exacerbate market volatility.
While lower oil prices are anticipated in 2025, most issuers in the oil and gas sector remain fundamentally strong, with cost structures well below forecast prices. The sector’s business diversity, from integrated companies to pure play producers and flexible capital expenditure (capex) strategies, provides resilience and investable opportunities under all market conditions.
Interest Rates and Financing Costs: Navigating a Higher Rate Environment
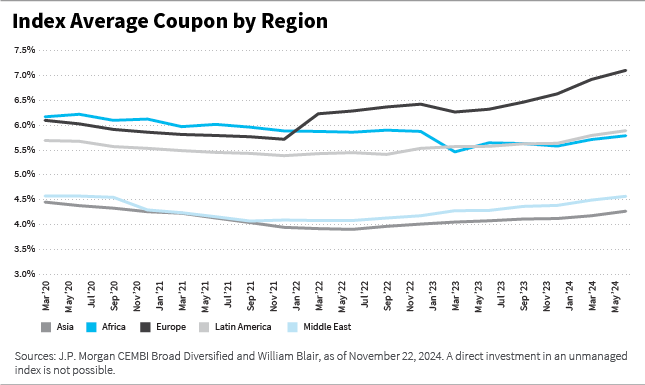
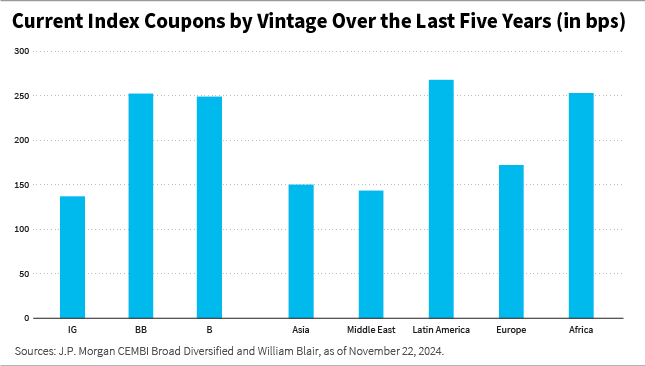
The trajectory of interest rates will likely continue to shape financing conditions for EM corporates. Higher rates translate into increased financing costs for new debt, potentially reducing free cash flow and financial flexibility.
Over the past few years, the average coupon for EM corporate debt has risen, with significant increases observed across all ratings. For instance, coupons for IG-rated bonds issued between 2020 and 2024 have increased by an average of 140 basis points, while coupons for lower-rated HY issuers rose by more than 250 basis points.
Despite these increases, many issuers have locked in lower rates in previous years, insulating them from immediate refinancing pressures. The maturity profile of the index remains stable, with approximately 5% of index bonds maturing in 2025 and 10% to 15% maturing annually over the next five years.
However, refinancing at current yields could lead to substantial increases in borrowing costs, particularly for shorter-maturity bonds. The diversity of the asset class means that issuers will likely respond differently to these challenges, highlighting the importance of bottom-up analysis to identify those best positioned to adapt.
Improved Default Rates: A Positive Outlook
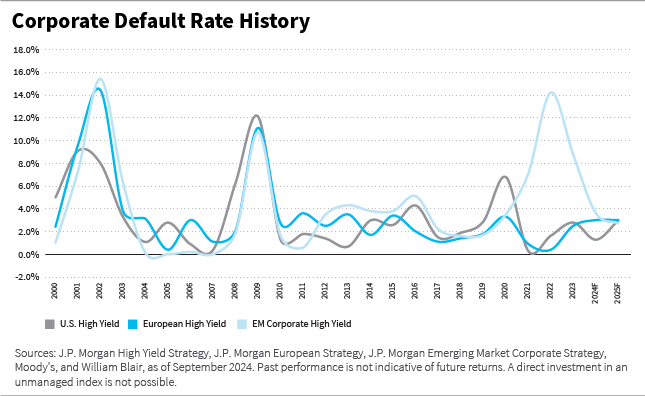
Default rates in the EM corporate universe have historically been comparable to those in DMs, averaging 3.6%[2]for HY issuers and under 1.5% for the overall index. And although the COVID-19 pandemic and subsequent economic shocks led to a spike in defaults, recent trends suggest a more benign outlook for 2025.
The default peak during the pandemic was driven by stress in the Chinese real estate sector, geopolitical conflicts, and capital controls in countries such as Argentina. However, default rates in regions such as the Middle East remain contained.
In addition, issuers continue to take adequate steps to address near-term maturities and diversify financing options, while local and private credit markets have provided additional flexibility, reducing reliance on international capital markets.
While idiosyncratic risks remain, the absence of a clear sector or country poised for widespread credit stress supports a favorable default outlook, in our view.
Conclusion: Opportunities in an Evolving Environment
As we enter 2025, the EM corporate debt landscape is shaped by both challenges and opportunities. Negative net supply dynamics, U.S. policy shifts, oil market uncertainties, rising interest rates, and a favorable default environment will collectively shape the near-term investment environment.
But the diversity of the asset class, which spans regions, sectors, and credit profiles, underscores the importance of detailed analysis to uncover relative value. With careful navigation, investors can capitalize on the nuanced themes driving EM corporate credit in the year ahead.
This blog is excerpted from our 2025 EM corporate debt outlook.
Luis Olguin, CFA, is a portfolio manager on William Blair’s emerging markets debt team.

[1]The J.P. Morgan Corporate Emerging Markets Bond Index (CEMBI) Broad Diversified is a market capitalization-weighted index that tracks the total returns of U.S.-dollar-denominated debt instruments issued by corporate entities in EM countries. (Index information has been obtained from sources believed to be reliable but J.P. Morgan does not warrant its completeness or accuracy. The indices are used with permission. The indices may not be copied, used, or distributed without J.P. Morgan’s prior written approval. Copyright 2024, JPMorgan Chase & Co. All rights reserved.) Index performance is provided for illustrative purposes only. Indices are unmanaged and do not incur fees or expenses. A direct investment in an unmanaged index is not possible. [2]Source: J.P. Morgan. CEMBI default rates are par weighted and based on bond stock at prior year-end. Note: Long-term average since 2002. 2024 level is as of September 2024.