Over the past decade, large-cap growth indices have delivered strong returns relative to many asset classes. But as index concentration has risen over this period, the largest issuers have become an increasingly sizable portion of the large-cap growth asset class and have been outsized contributors to index performance.
As a result of the growing market concentration, the majority of passive funds have also become top-heavy as their exposure to the largest index constituents moves in lockstep. Passive investors are essentially betting on the future success of a small subset of companies.
Active managers, unlike their passive counterparts, are not anchored to the dominant weights in the index and may be well positioned to navigate an evolving market landscape.
William Blair’s Large Cap Growth strategy and risk-management framework have remained consistent throughout varying levels of concentration in the index.
Large-Cap Growth Index Concentration—A Closer Look
The performance of the large-cap growth asset class has been strong over the past decade. The Russell 1000 Growth Index, which is a representative benchmark for the large-cap growth asset class, has returned over 15% per annum for the 10-year period ending June 30, 2023.
This time frame has also coincided with a notable increase in concentration within the index. As of June 30, 2023, the cumulative weight of the top 10 constituents in the Russell 1000 Growth Index encompassed approximately 53% of the index's total weight, as shown in the chart below. Furthermore, the top five constituents accounted for roughly 41% of the index weight. This presents a substantial increase compared to a decade ago, when the weightings were less than half of these figures in each category.
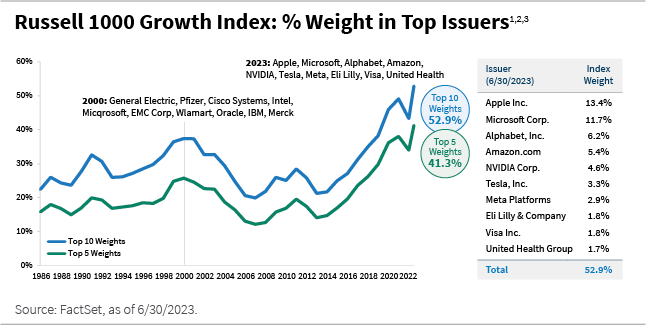
Moreover, during the late 1990s and at the peak of the dot-com era, the index exhibited heightened concentration. In subsequent years, index leadership diversified. This ensuing period proved to be a strong environment for active management.
Growing Index Concentration Challenges Active Management
As concentration within the index has increased, performance leadership has also narrowed. Although the index has delivered strong returns over the past decade, this surge in concentration has led to performance being heavily reliant on a select few companies. As the goal of most active managers is to outperform their benchmarks over time, weighting differences in individual stocks becomes necessary to generate alpha.
However, the rise in index concentration has introduced portfolio construction challenges due to potential risk tolerance concerns in holding large positions in a small number of stocks. Rising concentration has made it challenging for active strategies to outperform passive funds, which typically systematically allocate escalating weights to stocks with the largest market capitalizations in following their respective index.
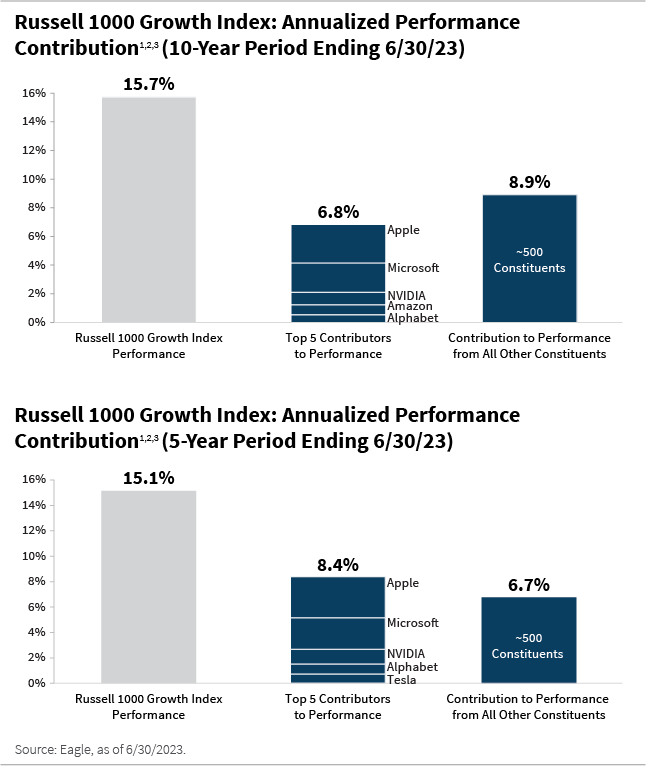
Over the 10-year period ending June 30, 2023, the return of the Russell 1000 Growth Index was driven significantly by the performance of five stocks which have accounted for nearly 45% of the index return, as shown in the chart below. This dynamic was even more pronounced over the five-year period ending June 30, 2023, as the performance of five stocks accounted for nearly 60% of the index return.
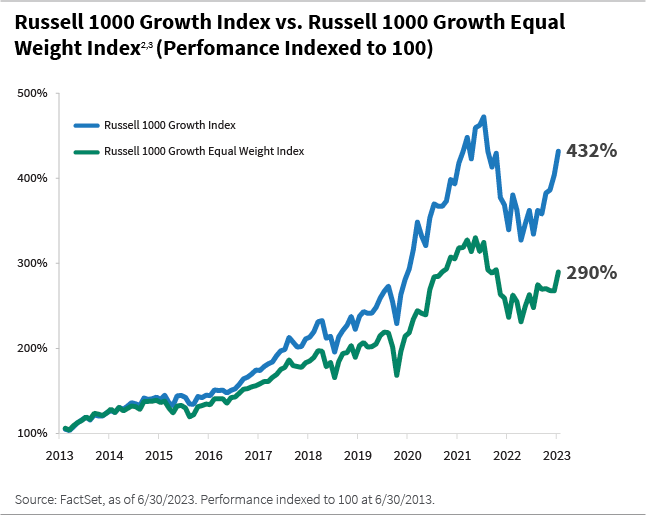
Furthermore, the chart below highlights the performance difference between the Russell 1000 Growth Index compared to an equal weighted version of the index, with all constituents having the same weighting. This again helps to highlight index performance was driven by a smaller subset of companies over this period.
According to data from eVestment, fewer than 20% of managers in the large-cap growth universe outperformed the index over this time frame. Active management performance appears to have been closely tied to the weighting of a select few companies within portfolios relative to their increasing weight within the index during this period. However, as we discuss next, performance headwinds for active large-cap growth managers may be changing as we look ahead.
Shifting Tides May Be Ahead
Predicting market bottoms or peaks remains elusive, often apparent only in hindsight, and a similar principle applies to index concentration and the timing of potential shifts. Nonetheless, what is evident is the current escalated level of concentration within large-cap indices.
As a result of growing market concentration, most passive funds have a disproportionate exposure to these stocks and do not have the ability to actively manage associated risks. Put another way, an investor who owns passive large-cap growth effectively owns everything in the index, including large position sizes in a small number of companies.
Our quality growth approach emphasizes identifying growing companies in growing industries—what we call structurally advantaged companies—whose long-term outlook is underappreciated by the market.
In contrast, active managers have the flexibility to be more selective among companies by overweighting, underweighting, or simply not owning index constituents, as well as trading in real time should company fundamentals, valuations, etc., change. As a result, active managers have the potential benefit of capturing upside and/or avoiding downside, unlike the index given its passive nature. This is important to note as the composition of the index continually evolves, with stocks going in and out of favor as their fundamentals change over time.
The market leaders of today may not necessarily maintain their position as leaders in the future. As we outline in the chart below, the composition of the largest issuers within the index today is notably distinct from that of the early 2000s.
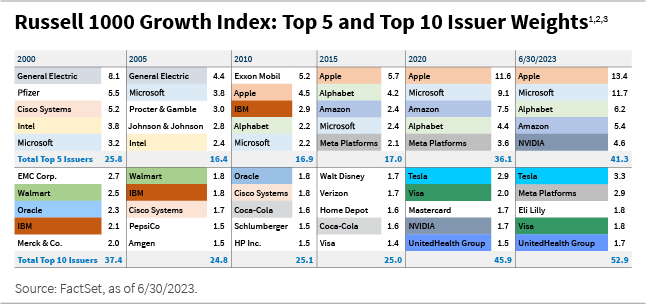
However, in a departure from previous periods characterized by frequent changes in index leadership, there has been remarkable consistency in the composition of the largest constituents over the past 10 years. The sustainability of this trend is uncertain and assuming that the increased concentration and consistency of the largest constituents will indeed persist into the future constitutes a potential risky bet over the long term.
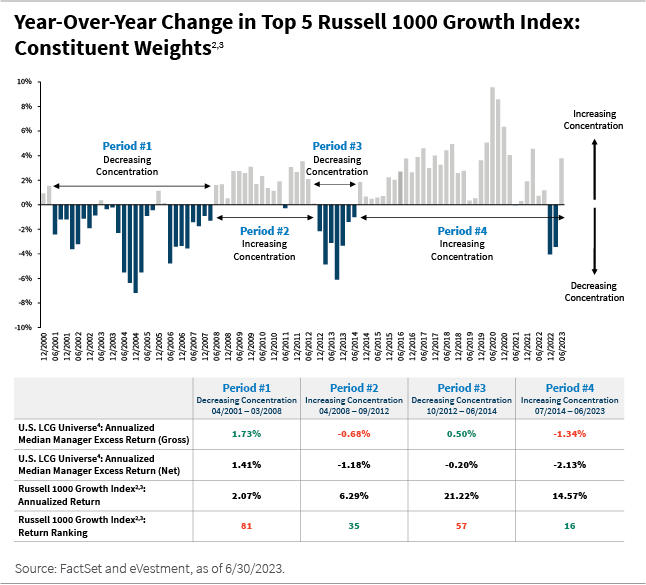
Historically, during periods of increasing concentration, active managers have lagged the index, as performance is more concentrated in a smaller subset of stocks. Conversely, during periods of decreasing concentration, the median manager in the large-cap growth universe generated positive excess return as the market landscape broadened.
The chart below illustrates the year-over-year change in the top five issuer weights of the Russell 1000 Growth Index as a way to measure periods of increasing/decreasing concentration in the index.
During periods of increasing index concentration, depicted as periods #2 and #4 in the chart, the median manager in the large-cap growth universe lagged the index return. During these periods, the index performance ranked in the top 50% of the large-cap growth universe.
Nonetheless, during periods of decreasing index concentration, shown as periods #1 and #3, the median manager outperformed the index return and the index performance ranked in the bottom 50% of the universe.
While gauging when the tide may turn is difficult to predict, it is increasingly clear that the concentration of the index is at all-time-high levels, and when the tide goes out, history suggests active managers may be in a position to benefit.
William Blair’s Active Approach to Large-Cap Growth
William Blair employs an active approach to large-cap growth investing, which revolves around identifying quality growth companies with the potential to generate alpha over the long term.
Identifying Quality Growth Companies Provides Alpha Potential
The William Blair Large Cap Growth strategy is a portfolio of 30 to 40 large-cap growth stocks. Our quality growth approach emphasizes identifying growing companies in growing industries—what we call structurally advantaged companies—whose long-term outlook is underappreciated by the market. We seek to invest in growing companies that can capture an increasing share of industry profits over a three- to five-year horizon.
Identifying and investing in these structurally advantaged companies is the primary way we seek to add value over time. Our in-depth research is focused on companies that operate in industries that we believe can grow at least as fast as the overall economy—preferably faster. We evaluate long-term secular drivers to gain confidence in the durability of an industry while staying mindful that some industries will have more cyclicality around that long-term growth trajectory.
Achieving Balanced Risk
An increasingly concentrated index presents risks that are difficult to mitigate for passive investors. In contrast, as active managers, we aim to manage benchmark-relative risk in our portfolio through diversification.
We recognize that diversification across sectors and market capitalizations plays a pivotal role in mitigating unforeseen risks and curbing volatility within our portfolio. Our belief stems from the understanding that substantial deviations in sector weights or market capitalizations can amplify the volatility of benchmark-relative returns, given the pronounced fluctuations in performance across these segments over time.
We want to generate portfolio returns from where we feel our competitive edge is strongest—company knowledge.
To counter this potential risk, an important element of our risk management approach is to maintain sector and market cap exposures that are approximately benchmark-neutral through the market cycle. This approach yields a portfolio in which alpha is predominantly generated by stock selection over the long term. This has led to a risk profile for our strategy that aligns more closely with peers that hold a greater number of stocks.
Overall, our risk-management approach helps to mitigate unintended risk within our portfolio. We realize substantial deviations in sector weights or market capitalizations versus the benchmark can amplify the volatility of benchmark-relative returns. Said another way, we want to generate portfolio returns from where we feel our competitive edge is strongest—company knowledge. Consistent with our investment philosophy, which emphasizes rigorous fundamental company analysis, a large portion of the portfolio’s tracking error typically originates from stock-specific risk. We aim to mitigate other factors that could potentially add volatility to relative returns.
In Summary
Performance of the large-cap growth asset class has become increasingly top-heavy, with investors biased toward the largest technology and tech-related stocks. We believe mean reversion among the largest constituents in the index is inevitable at some point, although trying to pinpoint when the tide will change can be an exercise of futility.
As active managers, we continue to focus on identifying structurally advantaged, quality growth companies that we believe can outperform over the long term. While gauging when the tide may turn is difficult to predict, it is increasingly clear that the concentration of the index is at all-time-high levels, and when the tide goes out, history suggests active managers may be in a position to benefit.
Aaron Socker is a portfolio specialist on William Blair’s U.S. growth and core equity team.
[1] Individual securities listed in this report are for informational purposes only. This information does not constitute, and should not be construed as, investment advice or recommendations with respect to the securities listed.
[2] The Russell 1000 Growth Index is an unmanaged index registered to Russell/Mellon. It measures those Russell 1000 companies with higher price-to-book ratios and higher forecasted growth values. It is a capitalization-weighted index as calculated by Russell on a total return basis with dividends reinvested. Indices are unmanaged and do not incur fees or expenses. A direct investment in an unmanaged index is not possible. Index performance is provided for illustrative purposes only. Past performance is not indicative of future results.
[3] The data and other information included herein has been provided for the intended recipient’s review only and may not be copied, reproduced, redistributed, published, retransmitted, or otherwise shared with any third party without written permission from William Blair.
[4] A Universe Construction Methodology: Large Cap Growth – US Equity products that invest primarily in large capitalization stocks with fundamental characteristics showing high earnings growth expectations or in fast-growing economic sectors. The expected benchmarks for this universe would include the Russell 1000 Growth, S&P 500 or the S&P/BARRA Growth. Managers in this category will typically indicate a “Primary Capitalization Emphasis” equal to Large Cap and a “Primary Style Emphasis” equal to Growth. Peer universe performance data run for separate account vehicles only. Average number of universe constituents for 3-year periods 350 and 5-year periods 317, as of June 30, 2023.
Tracking Error measures the extent to which a portfolio tracks its benchmark. The tracking error of an index portfolio should be lower than that of an active portfolio. The tracking error will always be greater than zero if the portfolio is anything other than a replication of the benchmark.