A rebound in the Chinese property sector, spurred by the post-COVID reopening and government support, was short lived, and the prospect of a broad recovery in 2023 seems unlikely due to high leverage and excess housing stock in lower-tier cities. As a result, investing in the Chinese property bond market is challenging.
But we see light at the end of the tunnel. Although the opportunity set has narrowed significantly, with more than half of developers we cover in deep distress (some facing default), we expect surviving developers to be less levered and more cautious about their future development, resulting in a healthier investment environment.
In this two-part series, we’ll take an in-depth look at the Chinese property market, first explaining how we got here, then delving into the outlook.
How Did We Get Here?
Credit-driven growth and speculative behavior in the property market led to tightening measures from Chinese policymakers. Specifically, in August 2020 the government implemented what it called the “Three Red Lines.” This policy imposed specific limits and requirements on property developers’ borrowing capacity in an effort to contain leverage growth in the sector.
Concurrently, the People’s Bank of China (PBOC) and China Banking and Insurance Regulatory Commission (CBIRC) established an upper limit to the ratio of mortgage and property loans in relation to the total outstanding loans for banks. Other tightening measures included limitations on bond quotas and access to escrow accounts, adding to the pressure on the sector.
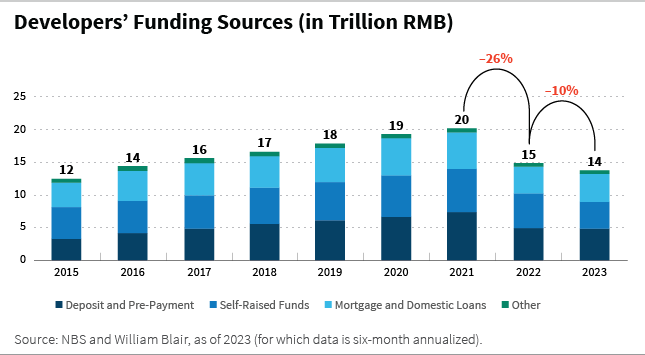
The developer business model also contributed to the downturn in the industry. Property developers relied heavily on presale financing, using buyer deposits for future projects (including new land acquisitions, which were then used as collateral for further borrowing). Developers also used creative forms of credit, including securitized loans and borrowing from trust and other shadow banking financial institutions, as the chart below shows.
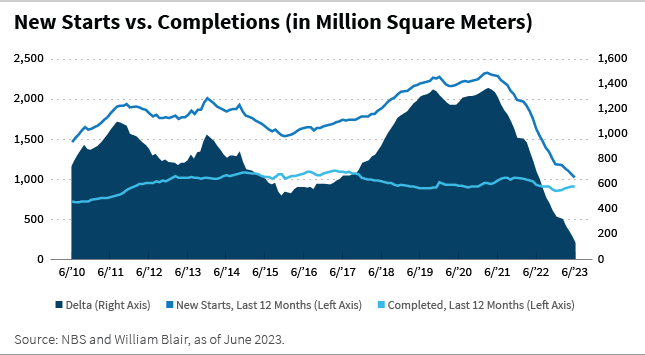
Notably, property developers also focused on new starts relative to completions, as the chart below shows. This lack of progress in project deliveries—aggravated by tighter financing conditions—would later spark the mortgage-payment boycotts that took place in 2022.
Meanwhile, heightened restrictions in mortgage lending and buyers’ disinterest in real estate during the zero-COVID period resulted in a decline in demand. This decline, coupled with funding constraints, triggered a profound liquidity squeeze, ultimately leading to a record number of debt defaults. As of June 2023, of the 45 developers we monitor, more than 20 have defaulted on their offshore bonds, representing 38% of the 2021 sales market share of developers in our coverage.
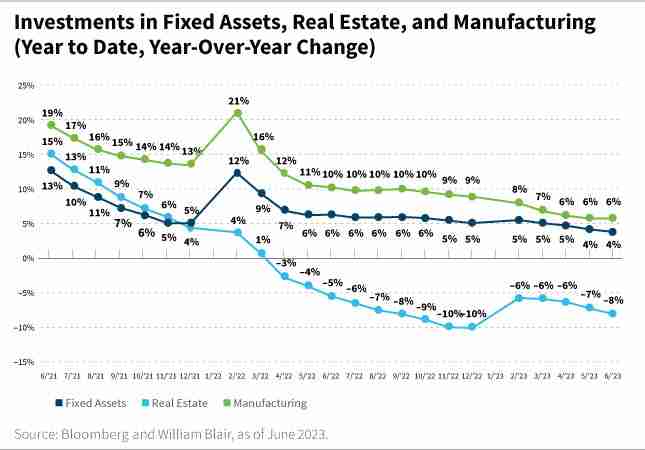
The surge in defaults, the underwhelming recovery prospects for the sector, and the lack of visibility in policy support have eroded market confidence. Even three years after the downfall of the sector, last-12-month sales through June 2023 were 16% lower and real-estate investments were 14% lower year-over-year.
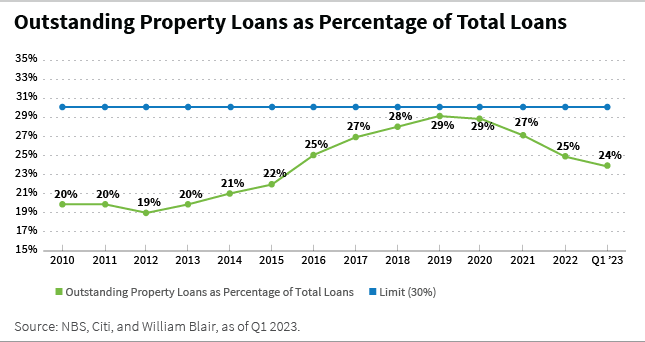
The sector’s leverage has also shown little improvement. While property loans as a percentage of total bank loans have decreased to 24% after reaching a peak of 29% in 2019, as the chart below illustrates, the sector’s leverage has shown little improvement.
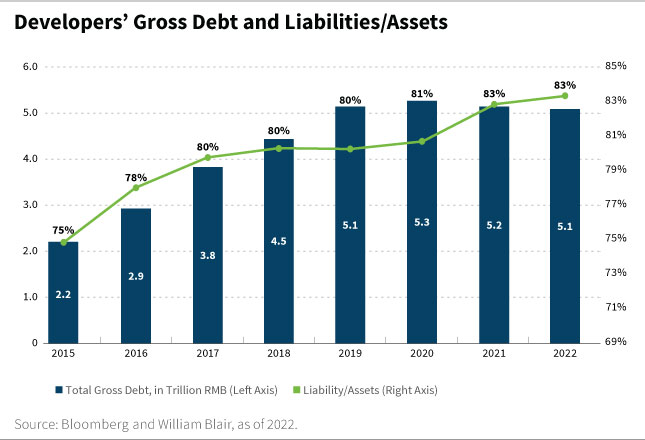
The estimated debt of the developers we track remained at RMB 5.1 trillion as of fiscal year 2022, only marginally lower than the peak. As the chart below shows, these developers’ ratio of liabilities to assets stands at 83%, higher than two years ago.
How Has the Chinese Property Market Changed Since 2020?
The varying responses and changing behaviors from Chinese regulators, property developers, home buyers, and financial market investors over the past few years have combined to reshape the Chinese property market in several ways.
First, there has been a fundamental shift in the government’s approach to stimulus.
During previous broad economic downturns in 2009, 2012, and 2015-16, the Chinese government used the usual tactics of credit expansion and investment spending to stimulate the economy.
However, the Xi Jinping era of Chinese growth, which emphasizes common prosperity and reconsolidation of power, led to several changes. These include 1) a regulatory clampdown on excesses, such as overpowering tech sectors and imbalanced educational opportunities from private institutions; 2) a demotion of the real-estate sector to a secondary growth engine; 3) a moderation of infrastructure spending due to over-construction; and 4) the transformation of the
Chinese growth model (which is now led primarily by the consumption, services, and manufacturing sectors, and new economies such as digital, technology, and renewables), as shown in the chart below.
When it comes to Chinese property, policies are aimed at stabilizing the sector by ensuring completion of ongoing projects rather than enabling unrestrained levered growth.
Second, a change in business models has affected local governments.
The business model for most Chinese property companies tended to focus on growing their land bank with rapid (sometimes excessive) construction. This led to high leverage. Now, developers are ditching their land-bank-expansion business models, instead prioritizing the completion of existing projects to unlock cash previously restricted in escrow accounts.
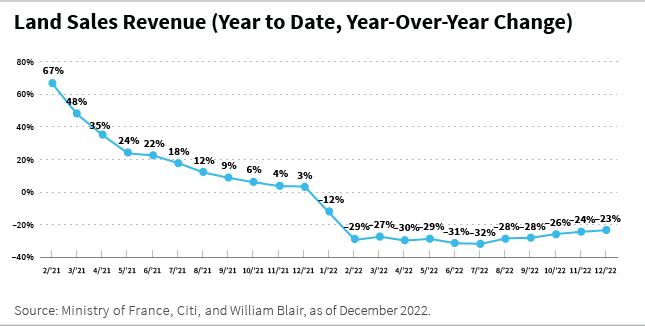
This changing strategy has exposed the extent to which local governments rely on land sales to developers for fiscal revenues. With land sales down 23% year-over-year as of fiscal year 2022 (see chart below), local governments are now resorting to lower (but stable) local tax revenues and higher transfer payments from the central governments to bridge fiscal shortfalls.
But fears have now emerged about the sustainability of local government financing vehicle (LGFV) debt issued over the past decade. Fiscal health is significantly impaired by the property sector downfall and changing business model of property developers—and is hitting low-income, geographically unprivileged local governments particularly hard.
Third, recoveries have differed by region.
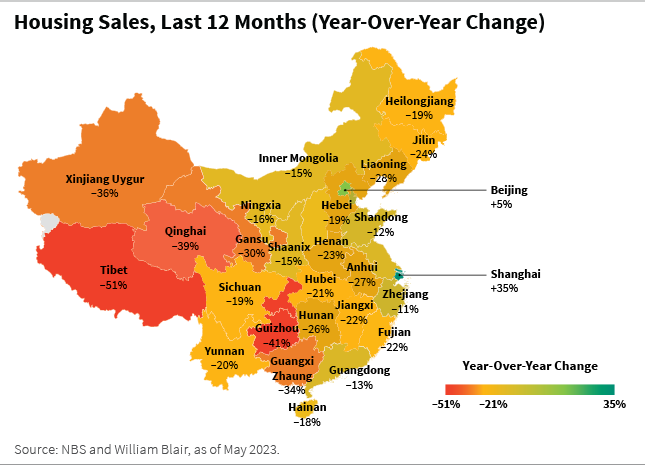
Given its vast size, China naturally has structural, demographic, and economic differences between regions. This has led to an uneven recovery in the property sector at a provincial level. For example, during the recent downturn, tier 1 cities (such as Beijing and Tianjin in the north), tier 2 cities, and the eastern provinces in general, whose local economies are dominated by the services sector, have shown strong resilience to both price pressures and volume adjustments.
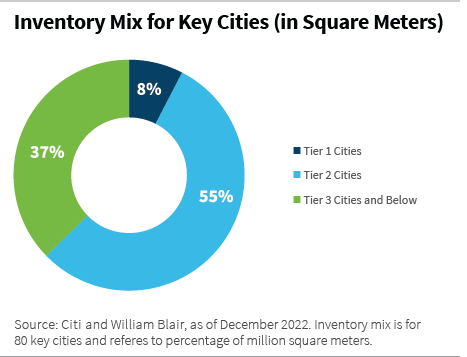
Conversely, tier 3 and tier 4 cities and landlocked provinces in central and western regions, which are mostly populated by lower-income households, fared much worse in sales and price adjustments given already high inventory levels, as shown below. Tier 3 and lower cities are also less economically diversified because their local economies are mainly driven by the manufacturing sector.
Fourth, trends in urbanization have changed.
Urbanization used to be the main driver of Chinese property sales growth. However, it appears that the urbanization rate is plateauing at a national average of 65%, with the 2022 urbanization rate growing less than 1% year-over-year in the last two years.
This view is also supported by an International Monetary Fund (IMF) study[1] that estimates the urbanization rate in tier 1 and tier 2 cities has already reached 90% and 80%, respectively. Tier 3 cities, however, still lag, with an urbanization rate of less than 60%.
The PBOC aims to lift the national average urbanization rate to 75% over the next decade to be more on par with developed markets, suggesting there could be incentives for the government to provide more support to homebuyers in lower-tier cities.
This will be a daunting task for the government: Not only must a major destocking process take place in lower-tier cities first, but weakening demographics (such as the first population decline in years in 2022) and high youth unemployment are also casting a shadow over the long-term growth prospects of the sector.
Coming Up
Stay tuned for part 2 of this series, in which we discuss China’s efforts to revive its property market and explain what we think is the way forward. Or, get that information now in our white paper.
Anezina Mytilinaiou, CFA, is a senior corporate credit analyst on William Blair’s emerging markets debt team.
Clifford Lau, CFA, is a portfolio manager on William Blair’s emerging markets debt team.
[1]Rogoff, Kenneth, and Yuanchen Yang. 2022. “A Tale of Tier 3 Cities.” IMF Working Paper 2022/196, International Monetary Fund, Washington, D.C.
Want the latest insights on the economy and other forces shaping the investment landscape?
Subscribe to our Investing Insights newsletter.
Any investment or strategy mentioned herein may not be appropriate for every investor. There can be no assurance that investment objectives will be met. Products and services listed are available only to residents of this jurisdiction and may only be available to certain categories of investors. The information on this website does not constitute an offer for products or services, or a solicitation of an offer to any persons outside of this jurisdiction who are prohibited from receiving such information under applicable laws and regulations. Nothing on this webpage should be construed as advice and is therefore not a recommendation to buy or sell shares.
Please carefully consider the William Blair Funds’ investment objectives, risks, charges, and expenses before investing. This and other information is contained in the Funds’ prospectus and summary prospectus, which you may obtain by calling 1-800-742-7272. Read the prospectus and summary prospectus carefully before investing. Investing includes the risk of loss.
The William Blair Funds are distributed by William Blair & Company, L.L.C., member FINRA/SIPC.
The William Blair SICAV is a Luxembourg investment company with variable capital registered with the Commission de Surveillance du Secteur Financier (“CSSF”) which qualifies as an undertaking for collective investment in transferable securities (“UCITS”). The Management Company of the SICAV has appointed William Blair Investment Management, LLC as the investment manager for the fund.
Please carefully consider the investment objectives, risks, charges, and expenses of the William Blair SICAV. This and other important information is contained in the prospectus and Key Investor Information Document (KIID). Read these documents carefully before investing. The information contained on this website is not a substitute for those documents or for professional external advice.
Information and opinions expressed are those of the authors and may not reflect the opinions of other investment teams within William Blair Investment Management, LLC, or affiliates. Factual information has been taken from sources we believe to be reliable, but its accuracy, completeness or interpretation cannot be guaranteed. Information is current as of the date appearing in this material only and subject to change without notice. Statements concerning financial market trends are based on current market conditions, which will fluctuate. This material may include estimates, outlooks, projections, and other forward-looking statements. Due to a variety of factors, actual events may differ significantly from those presented.
Investing involves risks, including the possible loss of principal. Equity securities may decline in value due to both real and perceived general market, economic, and industry conditions. The securities of smaller companies may be more volatile and less liquid than securities of larger companies. Investing in foreign denominated and/or domiciled securities may involve heightened risk due to currency fluctuations, and economic and political risks. These risks may be enhanced in emerging markets and frontier markets. Investing in the bond market is subject to certain risks including market, interest rate, issuer, credit, and inflation risk. High-yield, lower-rated, securities involve greater risk than higher-rated securities. Different investment styles may shift in and out of favor depending on market conditions. Diversification does not ensure against loss.
Past performance is not indicative of future returns. References to specific companies are for illustrative purposes only and should not be construed as investment advice or a recommendation to buy or sell any security.
William Blair Investment Management, LLC is an investment adviser registered with the U.S. Securities and Exchange Commission.
Issued in the United Kingdom by William Blair International, Ltd., authorized and regulated by the Financial Conduct Authority (FCA), and is only directed at and is only made available to persons falling within articles 19, 38, 47, and 49 of the Financial Services and Markets Act of 2000 (Financial Promotion) Order 2005 (all such persons being referred to as "relevant persons").
Issued in the European Economic Area (EEA) by William Blair B.V., authorized and supervised by the Dutch Authority for the Financial Markets (AFM) under license number 14006134 and also supervised by the Dutch Central Bank (DNB), registered at the Dutch Chamber of Commerce under number 82375682 and has its statutory seat in Amsterdam, the Netherlands. This material is only intended for eligible counterparties and professional clients.
Issued in Switzerland by William Blair Investment Services (Zurich) GmbH, Talstrasse 65, 8001 Zurich, Switzerland ("WBIS"). WBIS is engaged in the offering of collective investment schemes and renders further, non-regulated services in the financial sector. WBIS is affiliated with FINOS Finanzomubdsstelle Schweiz, a recognized ombudsman office where clients may initiate mediation proceedings pursuant to articles 74 et seq. of the Swiss Financial Services Act ("FinSA"). The client advisers of WBIS are registered with regservices.ch by BX Swiss AG, a client adviser registration body authorized by the Swiss Financial Market Supervisory Authority ("FINMA"). WBIS is not supervised by FINMA or any other supervisory authority or self-regulatory organization. This material is only intended for institutional and professional clients pursuant to article 4(3) to (5) FinSA.
Issued in Australia by William Blair Investment Management, LLC (“William Blair”), which is exempt from the requirement to hold an Australian financial services license under Australia's Corporations Act 2001 (Cth). William Blair is registered as an investment advisor with the U.S. Securities and Exchange Commission (“SEC”) and regulated by the SEC under the U.S. Investment Advisers Act of 1940, which differs from Australian laws. This material is intended only for wholesale clients.
Issued in Singapore by William Blair International (Singapore) Pte. Ltd. (Registration Number 201943312R), which is regulated by the Monetary Authority of Singapore under a Capital Markets Services License to conduct fund management activities. This material is intended only for institutional investors and may not be distributed to retail investors.
Issued in Canada by William Blair Investment Management, LLC, which relies on the international adviser exemption, pursuant to section 8.26 of National Instrument 31-103 in Canada.
The content contained in this site is intended as informational or educational in nature and does not constitute investment advice or a recommendation of any investment strategy or product for a particular investor. Investment advice and recommendations can be provided only after careful consideration of an investor’s objectives, guidelines, and restrictions. Investors should consult a financial professional/financial consultant or investment adviser before making any investment decisions. Investing includes the risk of loss.