China has exhibited one of the most transformational evolutions ever seen in emerging markets (EMs), with its weight in the MSCI EM Index doubling over the past five years. But China’s own dynamic and mega-cap stocks have somehow skewed EM benchmarks’ performance. We believe that beyond China, EMs offer an attractive and differentiated opportunity set—one which drove our launch of our EM ex China Growth strategy.
Why did William Blair launch an EM ex China strategy?
In brief, China has become the predominant market within EM indices, and while there would likely be some setbacks over shorter time periods, the country’s weighting appears poised to continue increasing over the long term amid the continued development of the equity market, growth and innovation, and further integration of China A-shares.
A natural consequence of the prominence of China’s inclusion in main benchmarks, market depth, and unique characteristics is that some investors may wish to implement a dedicated strategic allocation to China, seeking to benefit from the abundant alpha opportunities China offers across sectors, market caps, and share classes. Another consequence is that the focus on the vast China opportunities may overshadow attractive investments in smaller emerging markets.
By launching our EM ex China Growth strategy, we seek to offer the potential for alpha generation across sectors, regions, and market capitalizations in the broad EM space—in Asia; Emerging Europe, Middle East and Africa (EMEA); and Latin America. This allows investors to have a deeper exposure to EM investment opportunities and complement a China allocation, including a zero allocation.
Just how big a role in EM indices does China play, and can you go into more detail about how that influenced the decision to launch an EM ex China Growth strategy?
Through its deep transformation and successful economic growth over the past decades, China has become the second-largest world economy, and Chinese companies have capitalized on changes in consumer patterns and scale and have become an engine of innovation and sustainable value creation.
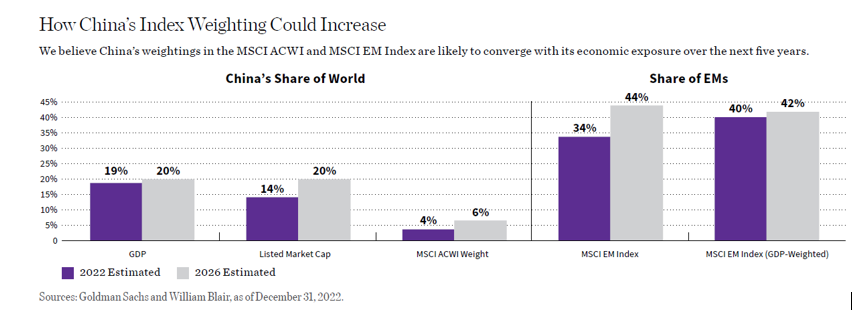
A natural consequence of this is that China’s weighting in the MSCI EM Index has increased from almost nonexistent in 2000 to 35% in 2022.
That said, China is still not even fully represented in the MSCI EM Index because the index artificially caps its domestic China A-share weighting, applying an inclusion factor of 20% to China A-shares. If this inclusion factor were 100%, China would represent closer to 45% of the index.
As China’s share of world gross domestic product (GDP) and listed market cap increases, so should its weight in both the MSCI All Country World Index (ACWI) and MSCI EM Index. Currently, China’s share of world GDP is 19% and its share of listed market cap is 14%. These numbers are expected to rise to 20% for both. As that happens, China’s weight in the MSCI ACWI and MSCI EM Index should continue to increase, as the chart below illustrates.
As a single country becomes such a prominent weight in the benchmark, its performance has an overwhelming impact on the entire asset class, blurring the contribution from smaller countries. As a result, it makes sense to differentiate that market from the rest of the space.
This is even more important in the case of China, as its specific macroeconomic, political, and regulatory developments have had a dominant impact on its equity market performance, and was largely desynchronized with the rest of emerging and developed markets.
How is the EM ex China Growth opportunity set different from the broad EM opportunity set?
Ex China, EMs have much more technology (particularly semiconductor and broad hardware), materials, and financials and less consumer discretionary and communications services than the MSCI EM Investable Market Index (IMI).
Heavyweights in these sectors such as Tencent, Alibaba, Meituan, and JD.com are eliminated. The MSCI EM ex China Index also has a higher weighting in commodities than the MSCI China Index.
From a regional perspective, as would be expected, when China is excluded, there is less exposure to Asia: Asia represents almost 80% of the MSCI EM Index and 70% in the MSCI EM ex China IMI.
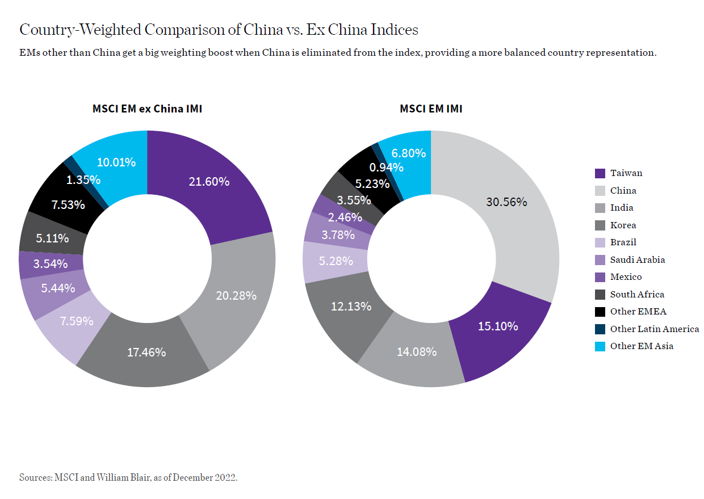
Eliminating China also boosts the weight of EMEA and Latin America by 5.5% and 3.8%, respectively, vs. the MSCI EM IMI. The chart below shows the country weightings in the MSCI EM IMI vs. the MSCI EM ex China IMI. Taiwan becomes the largest market in the MSCI EM ex China IMI, alongside India and Korea. But every other market, from Brazil to Mexico, gets boosted as well. This certainly provides a more balanced representation of EM countries within Asia and regions other than Asia.
What does the investable opportunity look like when you remove China?
Even after removing China, EMs offer a deep opportunity set with more than 1,000 listed larger-cap stocks (those with at least $2 billion of market cap). More than half of those trade at least $10 million per day. That suggests that there are significant investable opportunities in EMs ex China.
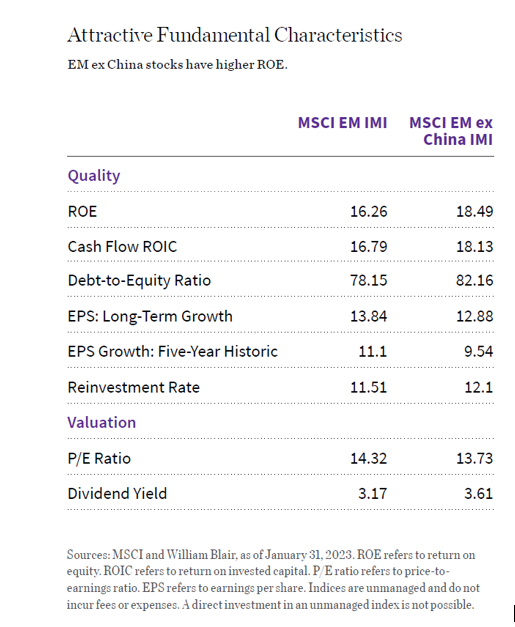
Meanwhile, quality characteristics of EMs ex China are attractive, as illustrated by higher return on equity (ROE) and cash flow return on invested capital (CFROIC) for the MSCI EM ex China IMI versus the MSCI EM IMI.
In addition, while the MSCI EM ex China IMI’s historic earnings per share (EPS) growth has lagged the broad index including China, earnings growth expectations show a marked improvement for the MSCI EM ex China IMI and valuations are more attractive.
Not surprisingly, EM ex China companies are well represented in our quality growth investment universe (our eligibility list). Our eligibility list, as of January 2023, includes 48% EM stocks, of which 68% are EM ex China names. That gives us approximately 650 EM ex China names to draw from.
What are attractive areas in EM ex China, in your view?
EMs have experienced significant changes over the past decade. Their key drivers are now largely growth sectors, such as IT and consumer, reflecting increased innovation and income growth and contrasting with the largely dominating commodity plays of the past.
The changing face of EMs has been underpinned by a surge of innovative, digitally enabled business models in e-commerce, communications services, and fintech, to name just a few areas. This phenomenon has been a key development in China—but also outside of China.
So, IT is a key theme in EMs ex China (IT and tech-related sectors account for 32% of the MSCI EM ex China IMI, close to 37% of the MSCI USA IMI, and well ahead of other developed markets, as the chart below illustrates).
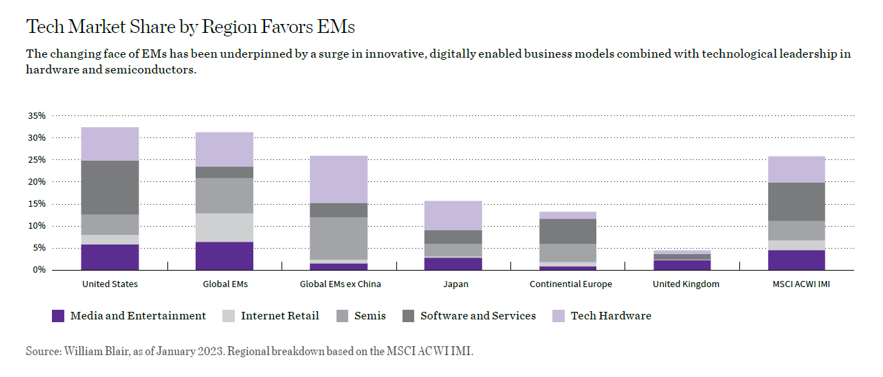
Within IT, EM ex China has a clear leadership in semiconductors and hardware, which are export-oriented and driven by global demand. In addition, financials are also a key sector; this provides more domestic exposure.
From a geographic perspective, India is a key market in the MSCI EM ex China IMI and a very attractive opportunity set for us.
Let’s talk about the EM ex China Growth strategy. What is the origin of this strategy and its design?
Given the market and index developments; conversations with clients and consultants; and an analysis of our expertise, track record, and opportunity set, we decided to launch our EM ex China Growth strategy in 2021. We first launched a private fund vehicle with seed money and sometime later launched a mutual fund in collaboration with an existing client in our broad EM Growth strategy.
The design of the strategy is similar to our longstanding flagship EM Growth strategy. That strategy offers broad exposure to high-quality growth names across EMs (including frontier markets) and sectors, and has a constant exposure to small-cap stocks. We believe this breadth provides broad sources of alpha, and is a differentiating feature of our EM ex China Growth strategy.
In addition to having a similar design as our EM Growth strategy, our EM ex China Growth strategy is managed by the same portfolio managers as the EM Growth strategy: Todd McClone, CFA, partner; Casey Preyss, CFA, partner; and Vivian Lin Thurston, CFA, partner, which further ensures consistency across these strategies.
Besides the China allocation, the main difference between our EM Growth strategy and our EM ex China Growth strategy is the number of holdings (typically 120 to 175 in EM Growth versus 80 to 130 in EM ex China Growth) and the maximum sector weighting (40% for EM Growth and 50% for EM ex China Growth). This is designed to reflect the opportunity set and larger IT weighting in the MSCI EM ex China IMI.
Naturally, the overlap between our EM ex China Growth and EM Growth strategies is typically high—greater than 90% as of January 2023. It is important to highlight that our EM ex China Growth strategy is actively managed by the team as a standalone strategy (meaning it is not an automatic carveout from our EM Growth strategy) and it continuously reflects what the team believes are the most attractive investment opportunities in EMs outside of China.
In managing the strategy, the team leverages the full breadth of the team’s platform, including attractive investment opportunities that are part of our EM Small Cap Growth strategy. Individual stock weightings are the result from conviction on fundamental thesis and portfolio fit as well as stock liquidity and, to some extent, weightings in the MSCI EM ex China IMI. Sector, country, and market-cap positioning are generally consistent with our EM Growth strategy, with the most noticeable difference being a higher weighting in financials and IT and a lower weighting in consumers and industrials.
Style exposure in our EM ex China Growth strategy is consistent with all other EM strategies managed by the team. They typically display higher-quality characteristics and stronger growth than their respective benchmarks. These attractive fundamental metrics typically result in higher P/E multiples.
Is there any kind of negative screening for a company that may be domiciled in, say, India but derives a large component of its revenue from sales into China?
We don’t look at geographic revenue to define eligibility (or non-eligibility) for this strategy. Our EM ex China Growth strategy does not invest in companies that have their principal offices in the People’s Republic of China (PRC). Mainland China, Hong Kong, and Macau are included in the definition of PRC.
If you’d like to learn more about our EM Ex China Growth strategy—including how we think about Taiwan and how we address environmental, social, and governance (ESG) considerations—please see our paper.

Romina Graiver, partner, is a portfolio specialist for William Blair’s global equity team.
The MSCI All Country World Index (ACWI) and the MSCI All Country World Index (ACWI) Investable Market Index (IMI) capture large- and mid-cap representation across 23 developed markets and 24 EMs. The latter is broader, with a larger number of securities. The MSCI China Index captures large- and mid-cap representation across China A shares, H shares, B shares, Red chips, and P chips. The MSCI Emerging Markets (EM) Index captures large- and mid-cap representation across 24 EMs. The MSCI Emerging Markets (EM) ex China Index captures large- and mid-cap representation across 23 of 24 EM countries excluding China. The MSCI Emerging Markets (EM) Investable Market Index (IMI) captures large-, mid- and small-cap representation across 27 EMs; the MSCI EM ex China Investable Market Index (IMI) excludes China. The MSCI USA Investable Market Index (IMI) is designed to measure the performance of the large-, mid-, and small-cap segments of the U.S. market. The MSCI World Index captures large- and mid-cap representation across 23 developed markets. Cash flow return on invested capital (ROIC) is a measure of how effectively a company generates cash flow based on capital investment. EPS: long-term growth represents the weighted average of forecasted growth in earnings expected to be experienced by stocks over the next three to five years. EPS growth: five-year historic reflects the weighted average earnings per share growth for stocks over the past five years. P/E ratio is the ratio of a stock’s current price to its per-share earnings over the past year.