Unique forces are set to shape the commodity markets in 2025: plentiful supplies threaten oil; rising tariff risks threaten the cleantech momentum for copper; supply challenges boost aluminium; and gold shines brighter amid economic and geopolitical uncertainty.
This commentary is based on a March 4, 2025, webinar.
Crude Oil
Global crude oil consumption was approximately 103 million barrels per day as of year-end 2024, with emerging markets (EMs) the main drivers of consumption. By 2030, we expect crude oil consumption to grow to about 105 million barrels, with EMs continuing to drive consumption and developed market countries reducing their usage. Gasoline remains the primary driver of oil demand, but its growth is expected to slow with rising electric vehicle (EV) adoption and the energy transition. However, this decline should be offset by increasing demand for industrial and jet fuels (which aren’t significantly cleaner).
On the supply side, OPEC’s share of global crude production has fallen from nearly 36% to below 30% as of 2024.
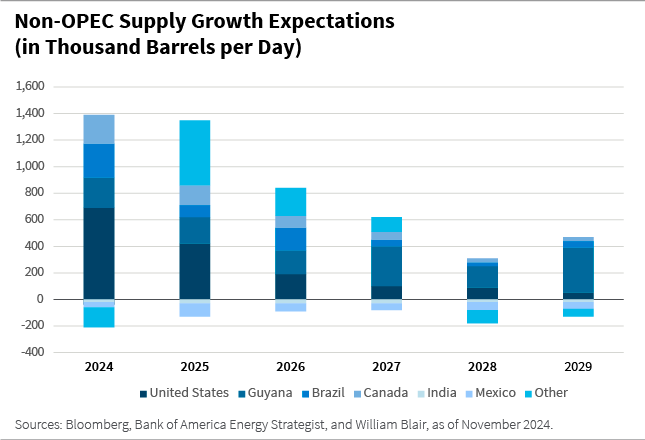
The United States has largely filled this gap, with shale production expanding significantly. The new administration aims to increase U.S. output from 13 million to 16 million barrels per day over time. Achieving this may be challenging, but a key distinction of U.S. shale production is its short lead time. Unlike traditional oil projects, which take three to five years from investment decision to production, U.S. shale can ramp up within a year (and sometimes within three months), making it a much faster and more flexible supply source.
Looking at other parts of the world, Asian oil production has declined slightly, while Europe’s, though not a major contributor, has dropped significantly. Russia has faced constraints, though less severe than initially expected under sanctions. However, some regions are seeing growth.
One of the fastest-growing producers is Guyana, where output has surged from near zero just a few years ago to around 650,000 barrels per day. Estimates suggest it could reach 1.5 million to 2 million barrels per day, making it one of the largest sources of new supply.
The outlook for other suppliers is mixed.
Mexico’s Pemex faces ongoing challenges, with production falling from 2.5 million to 1.6 million barrels per day due to underinvestment, brain drain, and aging infrastructure. Without significant reforms or partnerships—unlikely but possible—this decline will be difficult to reverse.
Brazil, on the other hand, is a growing focus. Petrobras has expanded production to nearly 3 million barrels per day while divesting assets, fueling the rise of smaller exploration and production (E&P) companies and service providers. This ecosystem is creating new investment opportunities, with production growth and sector maturity expected to continue.
Canada remains a key producer, though U.S.-Canada tariff tensions add some uncertainty. However, its heavier crude requires specialized refining, particularly in the U.S. Midwest, creating a symbiotic relationship that is likely to endure despite political volatility.
But it’s not just about supply and demand; as a quote from the International Energy Agency (IEA; circa 2005-2006) states, “Oil is driven by a multitude of factors that vary in influence over time.” Our approach involves analyzing these many variables, so let’s look at a few.
We believe several positive factors are likely to support oil markets.
- U.S. demand is expected to rise slightly, aided by a favorable energy policy environment.
- China, despite recent slowing, should see a rebound, albeit at a more moderate growth rate.
- Non- Organization for Economic Cooperation and Development demand remains a strong driver as global growth outside developed markets continues.
- U.S. pressure on rogue producers such as Iran and Venezuela could tighten supply, creating further upward momentum.
- Lastly, global inventories are currently low, adding another layer of support for oil prices.
Additional positive factors, though less certain, could also support oil markets.
- OPEC has been holding back production since COVID, and while some barrels have been released, a full return remains uncertain.
- If supply from rogue producers is curtailed, OPEC may be incentivized to release more barrels selectively.
- Low speculative positioning is another potential driver—financial market activity in crude futures could create volatility, but if positioning remains low, it may support prices as it normalizes.
- Geopolitical risks, while unpredictable, tend to drive an oil price premium when tensions rise.
- OPEC’s supply constraints have increased spare capacity, providing a potential buffer for market stability.
We believe several negative factors are likely to impact oil markets.
- The oil-dollar correlation fluctuates, but a strong dollar generally weighs on oil prices, as we've seen recently.
- U.S. supply growth, coupled with headlines about unleashing U.S. energy dominance, could also put downward pressure on prices.
- Non-OPEC supply growth—from producers like Guyana, Brazil, the United States, and Canada—adds to the supply-side pressure.
- Additionally, rising EV penetration continues to erode gasoline demand, creating a long-term headwind for oil consumption.
Additional negative factors, though less certain, could also put downward pressure on oil markets.
- At some point, OPEC will release withheld barrels, increasing supply and weighing on prices.
- Capital expenditure (capex) budgets are also rising, particularly among supermajors, even as companies continue to generate free cash flow.
- Lastly, the energy transition remains a long-term factor. While U.S. policy shifts may slow its pace, the global push toward alternative energy sources continues to reshape demand dynamics.
After considering these factors, what’s in store for oil prices? Looking at historical trends provides some context. During COVID we saw WTI prices briefly dip into negative territory due to extraordinary circumstances, while Brent remained low but never turned negative. As demand rebounded and COVID-related shutdowns eased, prices surged past $100, further driven by the Russia-Ukraine war and resulting sanctions on a major oil producer. OPEC’s gradual release of withheld barrels then put downward pressure on prices, leading to a stabilization between $70 and $90 over the past few years. Despite fluctuations, oil prices have remained relatively within this range.
Looking ahead, we expect some U.S. demand growth and a boost from China’s stimulus, both positive factors. On the other hand, OPEC’s eventual supply release and rising non-OPEC production will likely exert downward pressure on prices. Currently, Brent sits around $75 per barrel and WTI around $71. Most sell-side analysts anticipate further declines, and we share that view.
For the companies we invest in, the focus remains on cost structure, operational efficiency, and barrel replacement rather than short-term oil price fluctuations. Management teams recognize that crude price volatility is inevitable, so we prioritize companies that can operate sustainably at $70 per barrel without significant credit risks. If prices rise, credit metrics improve but most of the upside accrues to equity value.
Copper
Copper is an industrial metal with broad applications. It’s used by a variety of industries, including construction (28%) and power (16%), the latter of which is increasing its share due to renewable energy applications. Use in transportation (13%) is also expanding, driven by EVs, which use three to four times more copper than conventional cars.
The energy transition is a major driver of copper demand, with clean energy currently accounting for about 25% of consumption. This share is projected to rise to 45% by 2040, with overall demand expected to increase by 40%—an additional 11 million tons—according to the IEA.
China accounts for nearly 60% of global copper demand, though its growth has fluctuated. In 2024, refined copper demand in China grew just 2%, compared to 9% in 2023 and 25% in 2021, largely driven by grid and renewable energy investments and EVs.

On the supply side, more than 80% of global mine production comes from EMs. Chile leads with 24% of global output, while the Democratic Republic of Congo (DRC) has seen double-digit production growth in recent years. Peru remains a major supplier as well.
After extraction, copper must be smelted and refined, with China dominating global refining capacity at 45%.
Copper prices surged in 2024, particularly in May, driven by short squeezes on Comex and speculation about a broader metals supercycle. Prices are also highly sensitive to China’s economic headlines, particularly around stimulus measures. In 2020 and 2021, supply concerns and low inventories pushed prices higher and kept them elevated.
Looking ahead, trade wars present the biggest downside risk, with U.S.-China tariffs already announced and further escalation a key uncertainty. However, strong green energy demand remains a positive catalyst, alongside China’s stimulus measures, which have yet to fully impact the market.
Gold
Gold demand saw strong positive trends last year, prompting a greater focus on the metal. The three main demand drivers are jewelry, which accounts for 50% of global demand, followed by central bank purchases and investment demand—including futures, exchange-traded funds (ETFs), coins, and bars.
China and India together make up about half of global gold demand, with historically strong physical consumption. In 2024, physical demand increased, though China’s numbers were more muted, possibly reflecting differing economic sentiment between the two countries.
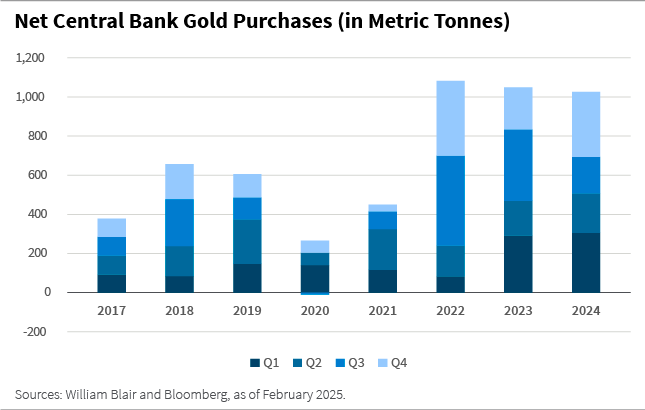
Since 2022, central bank gold purchases have remained high, contributing significantly to demand. In 2024 we saw gold purchases at similar levels to 2022, which was a year of high demand of gold from central banks. China, in particular, has been steadily increasing its gold reserves over the past 15 years, accelerating since 2022 as part of a broader de-dollarization strategy and a hedge against geopolitical risks. Other major holders include Japan, Switzerland, and the United States.
Investor positioning has also been strengthening, with futures markets showing increasing long positions—a sign of optimism. Similar trends are evident in ETFs, bars, and coins, though positioning does not yet appear overstretched, suggesting further upside potential.
Gold prices recently broke above $2,950, continuing a strong upward trend throughout 2024. Several factors have contributed, including geopolitical risks and economic uncertainty—drivers that are expected to persist, which may limit downside risks. However, sustained high prices could dampen demand, particularly in the jewelry sector and potentially among central banks.
Aluminum
Aluminum, another industrial metal, shares many similarities with copper, and has comparable demand trends across key sectors.
China dominates the market, accounting for 58% of global aluminum demand and holding the largest smelting capacity, making it the top producer. Europe also plays a significant role, representing 14% of demand.
The energy transition is a major driver, with green demand—renewable energy, EVs, and grid updates—currently making up 8% of total aluminum demand. This share is expected to rise to 18% by 2030, further supporting long-term growth.
In 2024, aluminum prices were elevated due to supply disruptions in alumina, a key feedstock, which squeezed producer margins and provided cost support for prices. Supply-driven price surges also occurred in 2022 following Russia’s invasion of Ukraine, as concerns over disruptions temporarily pushed aluminum prices higher. While supply chains have since adjusted, we believe ongoing energy transition demand and potential supply constraints create a positive outlook for aluminum going forward.
The Investment Opportunities
We’ve analyzed the fundamentals of key commodity sectors within the EM debt universe, including independent and national oil, aluminum, copper, and gold companies.
Leverage trends have generally improved since the COVID period, with a notable decline in aluminum companies. Gold companies, in contrast, have maintained stable leverage, reflecting their strong credit quality—something also seen in other sectors.
Margins across most commodity sectors remain high, at or above 50%, and have been relatively stable over time. Aluminum, however, continues to experience lower margins due to its energy-intensive and higher-cost production process, making it a structurally less profitable sector compared to others.
But understanding a company’s position in its credit cycle is crucial to making sense of bond yields. Most commodity sectors offer a broad range of yields, creating diverse investment opportunities. Gold and copper companies, for example, typical yield between 5% and 8% in today’s markets. Aluminum yields tend to be a bit lower. Independent oil companies vary significantly, with smaller producers (20,000 to 30,000 barrels per day) differing from larger ones (150,000 to 250,000 barrels per day), but yields generally average close to 9%.
On the national oil company side, yields range from 5% to 9%, influenced by credit quality and country risk, with an average around 7%. Duration is less of a factor in the difference in yields, as most bonds in this universe are five- to seven-year maturities, though national oil companies sometimes issue longer-dated debt. Overall, there is a wide set of opportunities for investors to identify the best risk-reward balance.
Luis Olguin, CFA, is a portfolio manager on William Blair’s emerging markets debt team.
Alexandra Symeonidi, CFA, is a senior corporate credit and sustainability analyst on William Blair’s emerging markets debt team.