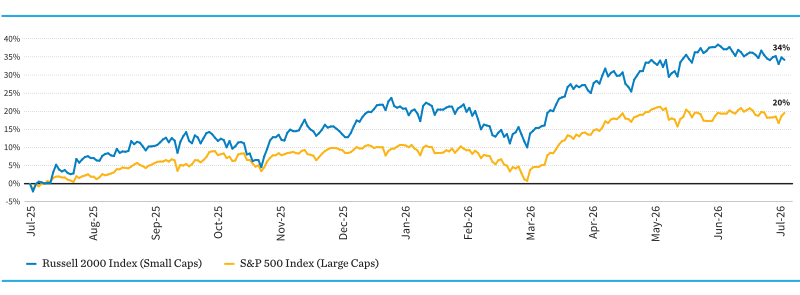
The long-awaited catalysts for small-cap outperformance appear to be showing up in returns: the asset class came in 1,400 basis points (bps) ahead of large caps over the trailing one-year period ended July 31, 2026.
Small-cap relative valuations remain near historic lows, even as consensus estimates project low-to mid-teens earnings growth over the next three years, a combination that may support a favorable entry point.
We believe deregulation, reshoring, and hyperscaler AI capex spend support a favorable environment for small caps, potentially offering investors a viable way to diversify away from heavy mega-cap concentration.
Despite delivering solid absolute returns in recent years, U.S. small-cap equities have consistently trailed their large-cap peers. Although relative valuations have remained compelling for some time, the asset class lacked the fundamental catalysts needed to drive durable earnings growth.
Today, however, those long-awaited catalysts—pro-business domestic policy, an easing regulatory environment, and massive capital deployment into AI infrastructure—appear to be taking hold.
With these catalysts in place, we believe small-cap leadership has begun to emerge, with the case for the asset class resting on five pillars: relative valuations near historical lows; earnings acceleration unfolding; AI infrastructure powering a durable supply chain; higher domestic exposure anchoring macro stability; and diversification away from mega-cap concentration.
A Year of Small-Cap Leadership
Over the past trailing one-year period ended July 31, 2026, small caps delivered both strong absolute and relative performance, outperforming large caps by 1,400 bps.
Sources: FactSet and William Blair, as of July 31, 2026. Past performance is not indicative of future returns. A direct investment in an unmanaged index is not possible.
Pillar 1: Relative Valuations Near Historical Lows
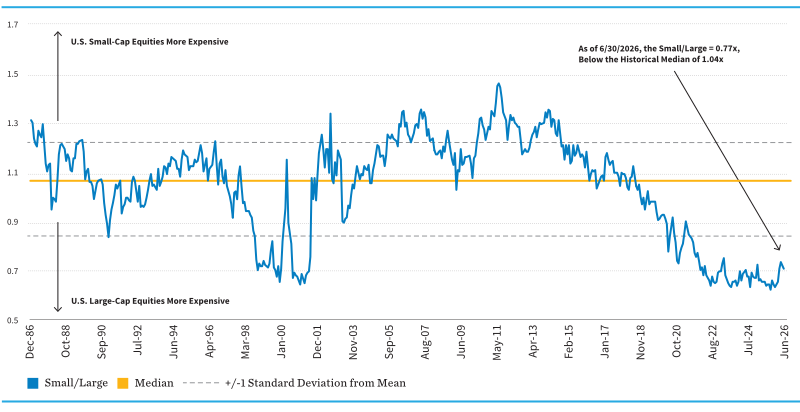
Small-cap stocks have historically commanded a slight premium to large-cap stocks, reflecting the higher growth and return potential typically associated with investing in smaller companies. As of 6/30/2026, small caps trade at a forward price-to-earnings (P/E) ratio of 0.77x relative to large caps, well below the historical median of 1.04x and outside the one standard deviation band.
Over the past decade, the relative decline in small-cap valuations compared to large-cap valuations can be attributed to several factors, such as subdued economic growth and slower earnings growth for small caps compared to large caps in recent years.
In contrast, the strong performance of large-cap indices has been significantly influenced by a small number of digitally oriented mega-cap stocks that have shown substantial acceleration in earnings and free-cash-flow growth, thereby boosting their valuations. Historically, periods of similarly wide small-cap discounts have preceded periods of small-cap outperformance, suggesting that today’s gap may represent a mean-reversion opportunity rather than a permanent repricing.
With valuations depressed and ownership light, any inflection in small-cap earnings growth could serve as a catalyst for a sustainable re-rating.
Relative Forward P/E Ratio: Small Caps vs. Large Caps
Small caps are trading at one of their steepest relative valuation discounts to large caps in decades, far below their long-run historical relationship, suggesting that the market is pricing in limited growth expectations for smaller companies, leaving room for re-rating if that view shifts.
Sources: Bank of America Merrill Lynch and William Blair, as of June 30, 2026. Valuation methodology excludes unprofitable companies. Small-cap equities are represented by the Russell 2000 Index; large-cap equities are represented by the Russell Top 200 Index. Past performance is not indicative of future returns. A direct investment in an unmanaged index is not possible.
Pillar 2: Earnings Acceleration Unfolding
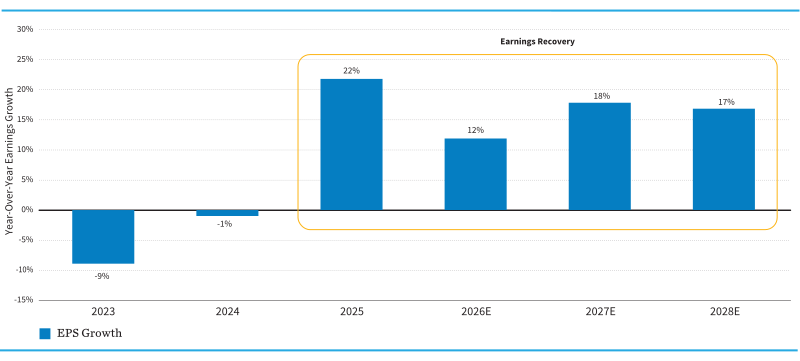
Small caps experienced an earnings recession between 2023 and 2024, driven in part by their heavier exposure to floating-rate debt and higher financing costs in a higher-rate environment.
But earnings growth also recently turned positive, marking an inflection with consensus estimates projecting low-to mid-teens growth over the next three years. This earnings growth acceleration also appears broad-based, spanning industrials, materials, and other cyclically oriented sectors tied to the AI infrastructure buildout and domestic manufacturing reshoring (rather than concentrated in a single narrow catalyst), which speaks to the durability of the recovery.
With earnings growth accelerating and valuations still at a meaningful discount to large caps, we believe small caps offer an entry point with an attractive risk/reward profile.
Small Caps Poised for Robust Earnings Growth
Small-cap earnings growth turned sharply positive in 2025 and is expected to remain robust through 2028, with consensus estimates projecting double-digit growth each year.
Sources: FactSet and William Blair, as of June 17, 2026. Small-cap equities are represented by the S&P 600 Index. A direct investment in an unmanaged index is not possible. E refers to estimated.
Pillar 3: AI Infrastructure Powering a Durable Supply Chain
We believe smaller-cap companies are well positioned to benefit from the substantial capital that several mega-cap technology firms have invested in building infrastructure related to AI. For example, capital expenditures (capex) from major tech firms (such as Microsoft, Amazon, Alphabet, Meta, and Oracle) are projected to cross $700 billion and $1 trillion over the next two years, respectively.
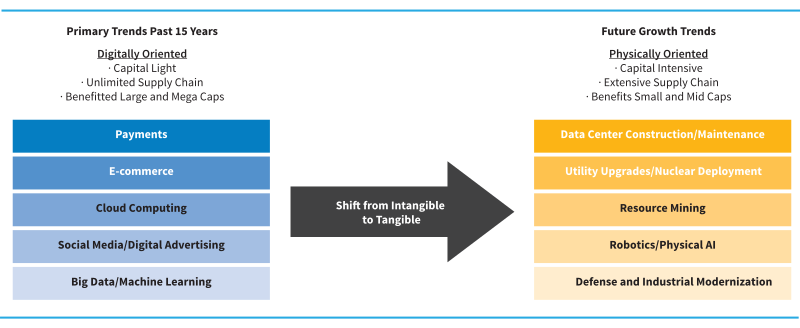
Sustained capex from these major hyperscalers could forge durable revenue streams for many smaller-cap companies, marking a departure from the capital-light, digitally oriented trends of the last 15 years. While large- and mega-cap companies benefitted from past secular trends such as e-commerce, cloud software, and digital payments through IP-based technology, the AI infrastructure buildout is powering a pervasive supply chain that disproportionately rewards smaller companies involved in verticals such as utility upgrades, resource mining, and data center construction and maintenance.
Many of the companies in our portfolio potentially have exposure to these growing end-markets and represent the “picks and shovels” of this secular movement. Moreover, the adoption of rapidly evolving AI tools should bolster productivity, allowing smaller firms to scale their capabilities and expand their margin profiles.
Small Caps: Investing in the Physical Buildout
The AI infrastructure buildout marks a shift to physically oriented, capital-intensive growth, spanning data centers, utilities, mining, and robotics, which tend to favor small and mid caps.
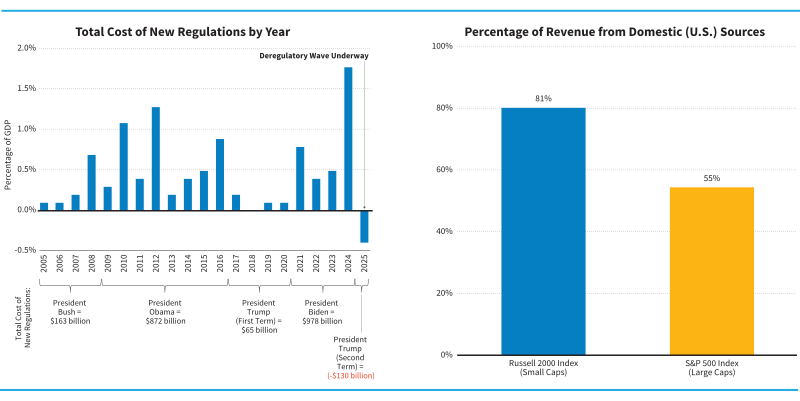
Between 2021 and 2024, regulations weighed heavily on growth, but the current U.S. administration has been rolling back rules, creating a more business-friendly regulatory backdrop. Reduced regulatory burden, lower corporate tax rates, and new domestic manufacturing incentives (paired with favorable capex write-offs) are driving innovation and sustained U.S. growth. We believe this is likely a tailwind for U.S. business expansion, with small caps positioned as prime beneficiaries.
In addition, a less onerous regulatory environment has induced more favorable conditions for merger and acquisition (M&A) activity. Years of regulatory constraints have fueled a significant backlog of deal-making demand. Attractively valued, quality-oriented small-cap firms are potentially prime targets for large-cap leaders looking to deploy strong balance sheets into their next phase of growth.
Moreover, small caps tend to offer purer domestic growth exposure and reduced sensitivity to currency and tariff/trade-policy swings that more heavily affect large-cap multinationals.
The Deregulatory Wave Meets a Domestic Revenue Advantage
2025 marked the first net reduction in regulatory costs in over two decades, reversing a multiyear buildup. We believe small caps stand to disproportionately benefit compared to large caps.
Sources: For left-hand chart, Piper Sandler, Doug Holtz-Eakin, American Action Forum, and William Blair, as of December 31, 2025. Estimated cost/savings values are based on proposed and final rules published in the Federal Register that include a quantified economic impact or paperwork burden estimate. For right-hand chart, FactSet GeoRev and Willaim Blair, as of December 31, 2025. Domestic revenue represents U.S.-derived revenue as a percentage of total revenue. GDP refers to gross domestic product.
Pillar 5: Diversification Away From Mega-Cap Concentration
Concentration in large-cap indices has reached historical extremes, with the top names now representing 38% of the S&P 500 Index’s market cap. This means large-cap index returns are increasingly tied to the performance of a handful of tech-oriented companies rather than broad-based earnings growth.
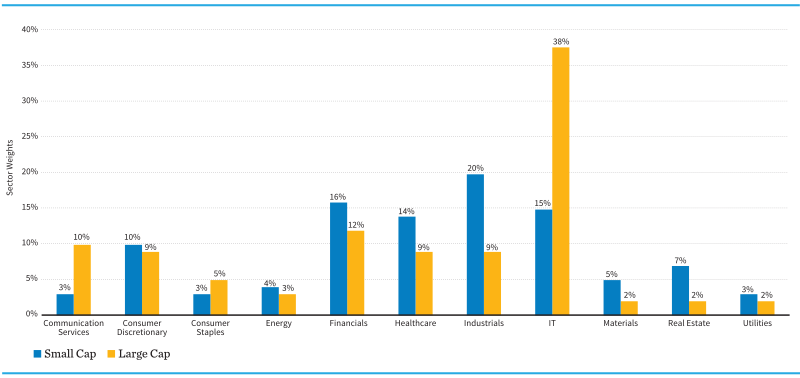
Small caps are weighted more toward financials, industrials, and healthcare, sectors that are underrepresented in large-cap indices dominated by mega-cap tech.
We believe small caps may offer a return stream less correlated to these mega-cap names, providing a genuine diversification benefit rather than simply a different flavor of the same concentrated exposure. Adding small caps can help reduce single-name and single-sector concentration risk at the total portfolio level. Historically, periods of extreme index concentration (e.g., the dot-com era) have preceded periods of broader market participation.
Small Caps Offer a Meaningfully Different Sector Mix
Small-cap indices carry heavier weights in financials, healthcare, and industrials. By contrast, large caps skew heavily toward technology, especially when factoring in the mega-cap tech giants housed within the communication services and consumer discretionary sectors.
Sources: FactSet and William Blair, as of June 30, 2026. Small caps are represented by the Russell 2000 Index. Large caps are represented by the S&P 500 Index. Diversification does not ensure against loss.
We Believe the Case for Small Caps Is Clear
With small-cap equities delivering 34% returns over the past trailing one-year period ended July 31, 2026, fundamental catalysts—such as robust AI supply-chain capex, broad-based earnings improvements, a more friendly domestic regulatory landscape, and near-historical valuation discounts—are gaining traction.
In our view, adding small-cap exposure not only helps mitigate extreme top-heavy market concentration, but also positions portfolios to potentially capture the next leg of broad-based U.S. economic growth. We believe current relative valuations and macro tailwinds support a favorable environment for small-cap equities. This may be the moment to lean in.
The Russell Top 200 Index is an unmanaged index registered to Russell/Mellon. It measures the performance of the 200 largest companies in the Russell 3000 Index. It is a capitalization-weighted index as calculated by Russell on a total return basis with dividends reinvested. The Russell 2000 Index is an unmanaged index registered to Russell/Mellon. It measures the performance of the 2,000 smallest companies in the Russell 3000 Index. It is a capitalization-weighted index as calculated by Russell on a total return basis with dividends reinvested. The S&P 500 Index is a capitalization-weighted index designed to measure the performance of approximately 500 large-cap U.S. publicly traded companies. It is widely considered a benchmark indicator of the overall U.S. stock market and economy. The S&P 600 Index is designed to track the small-cap market segment. Indices are unmanaged and do not incur fees or expenses. A direct investment in an unmanaged index is not possible.
Subscribe Now
Want the latest insights on the economy and other forces shaping the investment landscape?
Subscribe to our Investing Insights newsletter.
Any investment or strategy mentioned herein may not be appropriate for every investor. There can be no assurance that investment objectives will be met. Products and services listed are available only to residents of this jurisdiction and may only be available to certain categories of investors. The information on this website does not constitute an offer for products or services, or a solicitation of an offer to any persons outside of this jurisdiction who are prohibited from receiving such information under applicable laws and regulations. Nothing on this webpage should be construed as advice and is therefore not a recommendation to buy or sell shares.
Please carefully consider the William Blair Funds’ investment objectives, risks, charges, and expenses before investing. This and other information is contained in the Funds’ prospectus and summary prospectus, which you may obtain by calling 1-800-742-7272. Read the prospectus and summary prospectus carefully before investing. Investing includes the risk of loss.
The William Blair Funds are distributed by William Blair & Company, L.L.C., member FINRA/SIPC.
The William Blair SICAV is a Luxembourg investment company with variable capital registered with the Commission de Surveillance du Secteur Financier (“CSSF”) which qualifies as an undertaking for collective investment in transferable securities (“UCITS”). The Management Company of the SICAV has appointed William Blair Investment Management, LLC as the investment manager for the fund.
Please carefully consider the investment objectives, risks, charges, and expenses of the William Blair SICAV. This and other important information is contained in the prospectus and Key Investor Information Document (KIID). Read these documents carefully before investing. The information contained on this website is not a substitute for those documents or for professional external advice.
Information and opinions expressed are those of the authors and may not reflect the opinions of other investment teams within William Blair Investment Management, LLC, or affiliates. Factual information has been taken from sources we believe to be reliable, but its accuracy, completeness or interpretation cannot be guaranteed. Information is current as of the date appearing in this material only and subject to change without notice. Statements concerning financial market trends are based on current market conditions, which will fluctuate. This material may include estimates, outlooks, projections, and other forward-looking statements. Due to a variety of factors, actual events may differ significantly from those presented.
Investing involves risks, including the possible loss of principal. Equity securities may decline in value due to both real and perceived general market, economic, and industry conditions. The securities of smaller companies may be more volatile and less liquid than securities of larger companies. Investing in foreign denominated and/or domiciled securities may involve heightened risk due to currency fluctuations, and economic and political risks. These risks may be enhanced in emerging markets and frontier markets. Investing in the bond market is subject to certain risks including market, interest rate, issuer, credit, and inflation risk. High-yield, lower-rated, securities involve greater risk than higher-rated securities. Different investment styles may shift in and out of favor depending on market conditions. Diversification does not ensure against loss.
Past performance is not indicative of future returns. References to specific companies are for illustrative purposes only and should not be construed as investment advice or a recommendation to buy or sell any security.
William Blair Investment Management, LLC is an investment adviser registered with the U.S. Securities and Exchange Commission.
Issued in the United Kingdom by William Blair International, Ltd., authorized and regulated by the Financial Conduct Authority (FCA), and is only directed at and is only made available to persons falling within articles 19, 38, 47, and 49 of the Financial Services and Markets Act of 2000 (Financial Promotion) Order 2005 (all such persons being referred to as "relevant persons").
Issued in the European Economic Area (EEA) by William Blair B.V., authorized and supervised by the Dutch Authority for the Financial Markets (AFM) under license number 14006134 and also supervised by the Dutch Central Bank (DNB), registered at the Dutch Chamber of Commerce under number 82375682 and has its statutory seat in Amsterdam, the Netherlands. This material is only intended for eligible counterparties and professional clients.
Issued in Switzerland by William Blair Investment Services (Zurich) GmbH, Talstrasse 65, 8001 Zurich, Switzerland ("WBIS"). WBIS is engaged in the offering of collective investment schemes and renders further, non-regulated services in the financial sector. WBIS is affiliated with FINOS Finanzomubdsstelle Schweiz, a recognized ombudsman office where clients may initiate mediation proceedings pursuant to articles 74 et seq. of the Swiss Financial Services Act ("FinSA"). The client advisers of WBIS are registered with regservices.ch by BX Swiss AG, a client adviser registration body authorized by the Swiss Financial Market Supervisory Authority ("FINMA"). WBIS is not supervised by FINMA or any other supervisory authority or self-regulatory organization. This material is only intended for institutional and professional clients pursuant to article 4(3) to (5) FinSA.
Issued in Australia by William Blair Investment Management, LLC (“William Blair”), which is exempt from the requirement to hold an Australian financial services license under Australia's Corporations Act 2001 (Cth). William Blair is registered as an investment advisor with the U.S. Securities and Exchange Commission (“SEC”) and regulated by the SEC under the U.S. Investment Advisers Act of 1940, which differs from Australian laws. This material is intended only for wholesale clients.
Issued in Singapore by William Blair International (Singapore) Pte. Ltd. (Registration Number 201943312R), which is regulated by the Monetary Authority of Singapore under a Capital Markets Services License to conduct fund management activities. This material is intended only for institutional investors and may not be distributed to retail investors.
Issued in Canada by William Blair Investment Management, LLC, which relies on the international adviser exemption, pursuant to section 8.26 of National Instrument 31-103 in Canada.
The content contained in this site is intended as informational or educational in nature and does not constitute investment advice or a recommendation of any investment strategy or product for a particular investor. Investment advice and recommendations can be provided only after careful consideration of an investor’s objectives, guidelines, and restrictions. Investors should consult a financial professional/financial consultant or investment adviser before making any investment decisions. Investing includes the risk of loss.