August 27, 2026 | Cross-Team
A Market in Transition

Chief Investment Strategist

Strategy Analyst
August 27, 2026 | Cross-Team
Chief Investment Strategist
Strategy Analyst
View Fund:
https://im.williamblair.com/investments/sicav-funds/lu0995405759-global-leaders-fund
View Fund:
https://im.williamblair.com/investments/sicav-funds/lu2093691256-emerging-markets-debt-hard-currency-fund

Markets have been remarkably resilient, underpinned by strong and accelerating economic growth. At the same time, elevated volatility and shifts in market leadership suggest that no single sector or industry is likely to dominate as we move further into the second half of 2026. In this environment, we believe stock selection should become increasingly important, with accelerating earnings growth as the key to identifying potential winners. In other words, we believe it’s a classic stockpickers’ market.
Equities posted strong gains across regions in the second quarter. U.S. all-cap equities[1] returned 15.7%, while emerging markets (EM) equities[2] gained 22.8%, and developed markets outside the United States[3] rose 14.0%. Global small-cap equities also advanced, returning 15.1%.[4]
Positive equity returns have largely carried into the third quarter. Quarter-to-date as of August 19, U.S. all-cap equities have gained 2.6%, non-U.S. developed-market equities are up 2.0%, and U.S. value equities[5] have risen 5.8%. The notable exception has been EMs, down 2.5% quarter to date, as the rotation in South Korean and Taiwanese companies tied to the AI technology and infrastructure buildout had an outsized effect on EM performance.
Industries that lagged in 2025 and the first half of 2026 have moved to the top of the leaderboard quarter to date.
Equity markets have remained resilient at the index level but are experiencing substantial churn beneath the surface. Globally, industries that lagged in 2025 and into the first half of 2026—such as leisure products, software, and healthcare (the latter including technology, life science tools, and biotech) have moved to the top of the leaderboard quarter to date.[6] Market leadership has not rotated into a defensive posture, but rather into industries that have typically performed well when economic activity has been healthy and expanding, consistent with the current growth backdrop.
Another way to see the rotation is through weekly S&P 500 Index returns. At the index level, the market was relatively flat from May through the end of July, despite considerable week-to-week volatility. Looking at the sectoral return drivers, broadly defined technology stocks drove the majority of the aggregate returns in April and May. Into June and July, technology detracted materially from S&P 500 Index performance, even as other sectors helped offset the decline. For active managers that were overweight AI-related technology and infrastructure beneficiaries, the reversal created a meaningful headwind—even though the broader index itself appeared relatively stable.
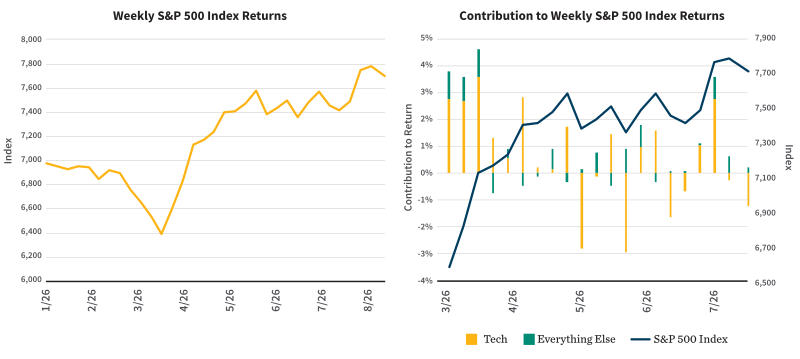
Sources: FactSet and WB Analysis, as of 8/19/2026. Past performance is not indicative of future returns. A direct investment in an unmanaged index is not possible.
What is underpinning the resilience in financial markets? Growth around the world remains strong.
Across broad measures of macroeconomic indicators on the supply and demand sides—including manufacturing purchasing managers’ index, auto sales, and inflation-adjusted retail sales—the latest data have generally improved compared to previous months.
Economic surprise indicators provide another lens on the strength of the global backdrop. Rather than measuring whether economic activity is strong or weak in absolute terms, they show whether incoming data are exceeding or falling short of market expectations. Developed-market economies are generally surprising to the upside: U.S. data continue to come in ahead of expectations, the euro area has rebounded sharply from its second-quarter trough, while Japan is delivering unusually strong upside surprises.
The EM picture is more mixed. Chinese data continue to disappoint relative to expectations, and Latin America has also been weaker than anticipated. EM Asia has lost some momentum as well, consistent with the broader cooling in AI-related technology and infrastructure activity.
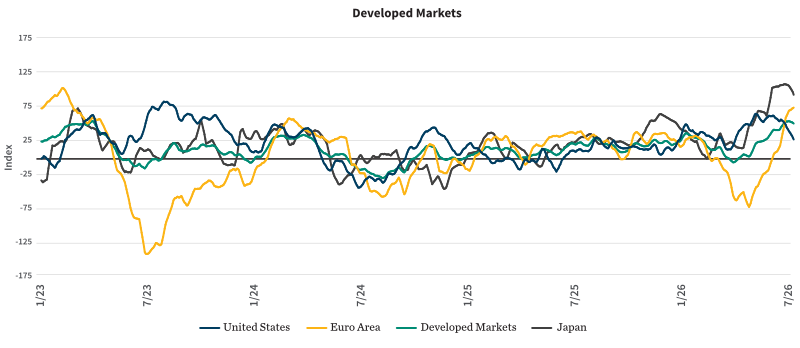
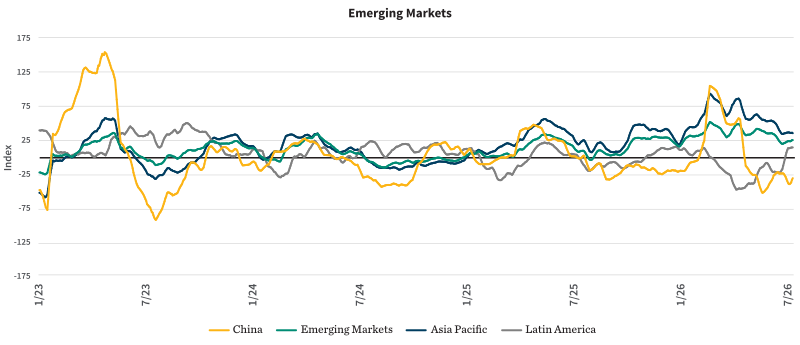
Source: Citi, as of 8/17/2026.
Economic activity is still relatively buoyant, and much of the developed world is performing better than markets had expected. The change in leadership appears less about investors preparing for an economic downturn and more about capital rotating within a still-expanding global economy.
Strong growth is supporting markets, but inflation is likely to remain volatile. Three forces, in particular, could keep price pressures unsettled through the second half of the year: energy prices, semiconductor prices, and tariffs.
Energy is the first source of uncertainty. Crude oil prices have been volatile, but the prices of refined products that businesses and consumers actually use—including gasoline and diesel—have risen more sharply. That matters as the Northern Hemisphere moves toward the period when inventories are typically rebuilt ahead of winter. Rapid price swings make it more difficult for companies to plan, procure inputs, and hedge exposures, particularly when commodities are priced in currencies different from those in which companies generate revenue. That uncertainty can weigh on demand even if outright energy prices ultimately moderate.
“Chipflation” could keep price pressures unsettled.
The second source is “chipflation.” Memory semiconductor prices have risen dramatically amid supply constraints. As chips are now ubiquitous in consumer-facing goods, from automobiles to coffee pots, higher prices along the semiconductor supply chain add upward pressure to goods inflation. However, there are signs that the pricing pressure, specifically in memory chips exported from South Korea, may be beginning to ease, which may also explain some of the recent rotation away from AI-related technology and infrastructure beneficiaries.
Tariffs represent the third source of uncertainty. After the Supreme Court invalidated the U.S. administration’s broad tariffs imposed under emergency-powers authority earlier this year, the administration has continued to pursue additional trade actions through various mechanisms, including Section 301. There is scope for further changes in tariff treatment, along with additional headline and policy uncertainty.
Together, these forces could keep inflation volatile even as economic growth remains healthy. That matters because inflation volatility can erode purchasing power and make planning more difficult for both households and businesses. In the United States and Europe, that pressure is increasingly visible in slowing real wage growth, creating a potential headwind for consumer demand as the year progresses.
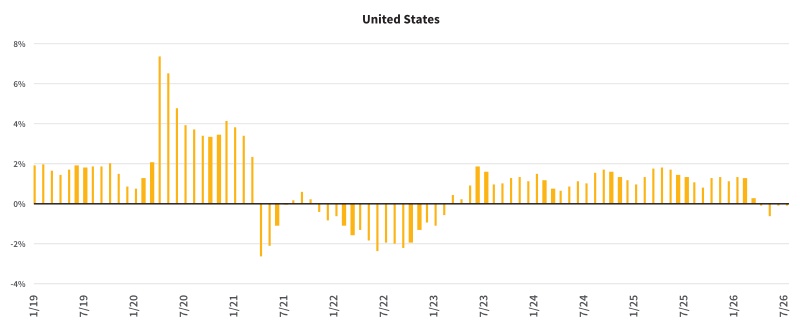
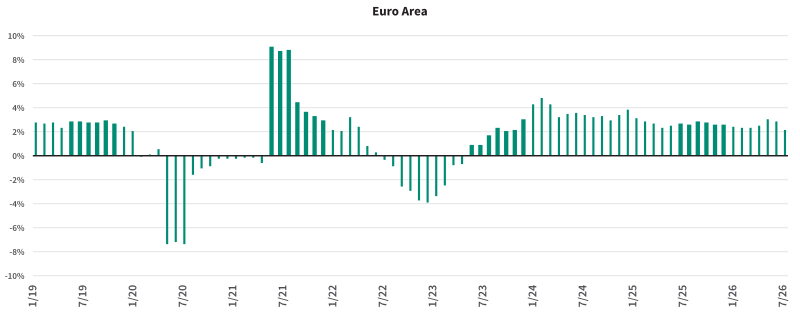
Sources: Eurostat (for Euro area data) and BLS/BEA (for U.S. data).
Rising government bond yields across developed markets have raised concerns about fixed-income performance and debt sustainability, but the rise in yields also reflects something more constructive: stronger demand for capital.
As investment in physical infrastructure, manufacturing capacity, energy, defense, and other tangible assets increases (as we discuss in “Revenge of the Tangibles”), so does capital spending. More capital spending means greater demand for financing, which in turn can put upward pressure on the cost of capital. That dynamic is evident across the yield curve, with bond yields all moving higher across all tenors in the United States, Japan, and Germany.
Yet higher rates do not necessarily imply worsening debt dynamics. What matters is the relationship between borrowing costs and nominal economic growth. If nominal gross domestic product (GDP) is growing faster than nominal interest rates, debt ratios can still improve even as yields rise. This scenario is playing out in Japan today: government debt to GDP peaked in 2022 and subsequently has fallen by 10%, while 10-year yields rose by nearly 200 basis points from 2022 through 2025.
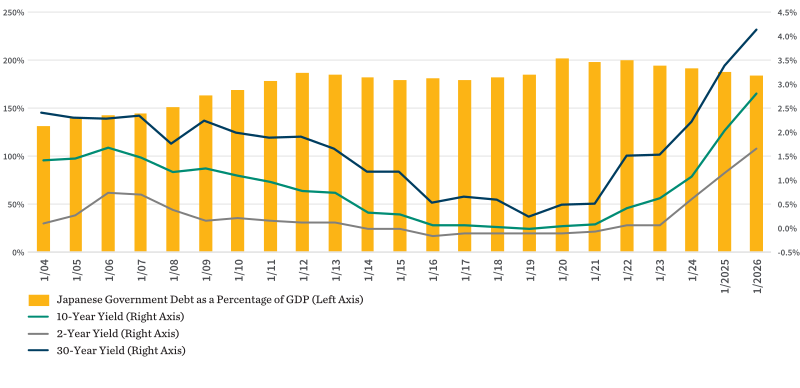
Sources: Bloomberg, BoJ, and Japanese Cabinet Office. 2026 government debt numbers are estimates. Government yields are as of 8/20/2026.
Markets have remained resilient in 2026, supported by strong and, in many cases, accelerating global growth. But beneath the surface, leadership is shifting: AI-related technology and infrastructure have lost momentum, a broader range of industries and countries are participating, and higher capital spending is helping push interest rates higher.
At the same time, inflation remains a source of uncertainty, with volatile energy prices, elevated semiconductor costs, and tariffs all contributing to a less predictable backdrop.
The result is an environment in which economic fundamentals remain supportive, but greater dispersion, higher capital costs, and less consistent market leadership could make security selection increasingly important in the second half of the year.
Olga Bitel, partner, is the chief investment strategist at William Blair.
Alexa Davis is a strategy analyst on William Blair’s global equity team.
[1]U.S. all-cap equities are represented by the MSCI USA IMI. [2]EM equities are represented by the MSCI EM IMI. [3]Developed markets outside the United States are represented by the MSCI ACWI ex-USA IMI Index. [4]Global small-cap equities are represented by the MSCI ACWI Small Cap Index. [5]U.S. value equities are represented by the MSCI USA IMI Value Index. [6] Source: MSCI ACWI grouped by GICS industry.
The MSCI (All Country World Index) ACWI is a free-float-adjusted market-capitalization-weighted index designed to measure equity market performance across developed and emerging markets worldwide. The MSCI ACWI ex-USA IMI Index captures large-, mid-, and small-cap representation across developed markets excluding the United States and EMs, covering approximately 99% of the global equity opportunity set outside the United States. The MSCI ACWI Small Cap Index captures small-cap representation across developed and EMs and covers approximately 14% of the free float-adjusted market capitalization in each country. The MSCI EMs IMI Index captures large-, mid-, and small-cap representation across EMs and covers approximately 99% of the free float-adjusted market capitalization in each country. The MSCI USA IMI Index measures the performance of the large-, mid-, and small-cap segments of the U.S. equity market, covering approximately 99% of U.S. free float-adjusted market capitalization. The MSCI USA IMI Value Index captures large-, mid-, and small-cap U.S. securities exhibiting value characteristics. The S&P 500 Index measures the performance of 500 leading U.S. companies and covers approximately 80% of available U.S. market capitalization.
View Fund:
https://im.williamblair.com/investments/sicav-funds/lu2511384518-us-large-cap-growth-fund
View Strategy:
https://im.williamblair.com/investments/separate-accounts/global-leaders
View Strategy:
https://im.williamblair.com/investments/separate-accounts/emerging-markets-debt-hard-currency
View Strategy:
https://im.williamblair.com/investments/separate-accounts/large-cap-growth
Want the latest insights on the economy and other forces shaping the investment landscape?
Subscribe to our Investing Insights newsletter.
Any investment or strategy mentioned herein may not be appropriate for every investor. There can be no assurance that investment objectives will be met. Products and services listed are available only to residents of this jurisdiction and may only be available to certain categories of investors. The information on this website does not constitute an offer for products or services, or a solicitation of an offer to any persons outside of this jurisdiction who are prohibited from receiving such information under applicable laws and regulations. Nothing on this webpage should be construed as advice and is therefore not a recommendation to buy or sell shares.
Please carefully consider the William Blair Funds’ investment objectives, risks, charges, and expenses before investing. This and other information is contained in the Funds’ prospectus and summary prospectus, which you may obtain by calling 1-800-742-7272. Read the prospectus and summary prospectus carefully before investing. Investing includes the risk of loss.
The William Blair Funds are distributed by William Blair & Company, L.L.C., member FINRA/SIPC.
The William Blair SICAV is a Luxembourg investment company with variable capital registered with the Commission de Surveillance du Secteur Financier (“CSSF”) which qualifies as an undertaking for collective investment in transferable securities (“UCITS”). The Management Company of the SICAV has appointed William Blair Investment Management, LLC as the investment manager for the fund.
Please carefully consider the investment objectives, risks, charges, and expenses of the William Blair SICAV. This and other important information is contained in the prospectus and Key Investor Information Document (KIID). Read these documents carefully before investing. The information contained on this website is not a substitute for those documents or for professional external advice.
Information and opinions expressed are those of the authors and may not reflect the opinions of other investment teams within William Blair Investment Management, LLC, or affiliates. Factual information has been taken from sources we believe to be reliable, but its accuracy, completeness or interpretation cannot be guaranteed. Information is current as of the date appearing in this material only and subject to change without notice. Statements concerning financial market trends are based on current market conditions, which will fluctuate. This material may include estimates, outlooks, projections, and other forward-looking statements. Due to a variety of factors, actual events may differ significantly from those presented.
Investing involves risks, including the possible loss of principal. Equity securities may decline in value due to both real and perceived general market, economic, and industry conditions. The securities of smaller companies may be more volatile and less liquid than securities of larger companies. Investing in foreign denominated and/or domiciled securities may involve heightened risk due to currency fluctuations, and economic and political risks. These risks may be enhanced in emerging markets and frontier markets. Investing in the bond market is subject to certain risks including market, interest rate, issuer, credit, and inflation risk. High-yield, lower-rated, securities involve greater risk than higher-rated securities. Different investment styles may shift in and out of favor depending on market conditions. Diversification does not ensure against loss.
Past performance is not indicative of future returns. References to specific companies are for illustrative purposes only and should not be construed as investment advice or a recommendation to buy or sell any security.
William Blair Investment Management, LLC is an investment adviser registered with the U.S. Securities and Exchange Commission.
Issued in the United Kingdom by William Blair International, Ltd., authorized and regulated by the Financial Conduct Authority (FCA), and is only directed at and is only made available to persons falling within articles 19, 38, 47, and 49 of the Financial Services and Markets Act of 2000 (Financial Promotion) Order 2005 (all such persons being referred to as "relevant persons").
Issued in the European Economic Area (EEA) by William Blair B.V., authorized and supervised by the Dutch Authority for the Financial Markets (AFM) under license number 14006134 and also supervised by the Dutch Central Bank (DNB), registered at the Dutch Chamber of Commerce under number 82375682 and has its statutory seat in Amsterdam, the Netherlands. This material is only intended for eligible counterparties and professional clients.
Issued in Switzerland by William Blair Investment Services (Zurich) GmbH, Talstrasse 65, 8001 Zurich, Switzerland ("WBIS"). WBIS is engaged in the offering of collective investment schemes and renders further, non-regulated services in the financial sector. WBIS is affiliated with FINOS Finanzomubdsstelle Schweiz, a recognized ombudsman office where clients may initiate mediation proceedings pursuant to articles 74 et seq. of the Swiss Financial Services Act ("FinSA"). The client advisers of WBIS are registered with regservices.ch by BX Swiss AG, a client adviser registration body authorized by the Swiss Financial Market Supervisory Authority ("FINMA"). WBIS is not supervised by FINMA or any other supervisory authority or self-regulatory organization. This material is only intended for institutional and professional clients pursuant to article 4(3) to (5) FinSA.
Issued in Australia by William Blair Investment Management, LLC (“William Blair”), which is exempt from the requirement to hold an Australian financial services license under Australia's Corporations Act 2001 (Cth). William Blair is registered as an investment advisor with the U.S. Securities and Exchange Commission (“SEC”) and regulated by the SEC under the U.S. Investment Advisers Act of 1940, which differs from Australian laws. This material is intended only for wholesale clients.
Issued in Singapore by William Blair International (Singapore) Pte. Ltd. (Registration Number 201943312R), which is regulated by the Monetary Authority of Singapore under a Capital Markets Services License to conduct fund management activities. This material is intended only for institutional investors and may not be distributed to retail investors.
Issued in Canada by William Blair Investment Management, LLC, which relies on the international adviser exemption, pursuant to section 8.26 of National Instrument 31-103 in Canada.


The content contained in this site is intended as informational or educational in nature and does not constitute investment advice or a recommendation of any investment strategy or product for a particular investor. Investment advice and recommendations can be provided only after careful consideration of an investor’s objectives, guidelines, and restrictions. Investors should consult a financial professional/financial consultant or investment adviser before making any investment decisions. Investing includes the risk of loss.
Copyright © 2026 William Blair. William Blair is a registered trademark of William Blair & Company, L.L.C. “William Blair” refers to William Blair Investment Management, LLC and affiliates.

