Through October, the year-to-date performance of U.S. small-mid-cap (SMID) equities, in comparison to large-cap equities, has been abysmal. The Russell 2500 Growth Index[i], for example, is down 1.7% while the Russell 1000 Growth Index[ii]is up 23.2%, a 25-point difference through the first 10 months of 2023. In my 37-year professional career, the calendar has never unfolded like 2023 other than in 1998, the precipice of the Internet bubble.
But the underperformance of smaller caps didn’t just start this year. Rather, it has extended for well over a decade and begs two questions: why has it occurred and what could reverse this trend?
While we will address both questions in detail, the bottom line is that investors should consider leaning into this phenomenon today rather than trying to time the market’s eventual pivot toward smaller-cap companies.
Market Shift: In Favor of SMID Caps?
While many variables undoubtedly drove the disparity in performance between large and SMID equities year-to-date, the influence of the “Magnificent 7” (Apple, Microsoft, Alphabet, Amazon, Nvidia, Meta, and
Tesla) provided a material benefit to larger-cap indices. In the first nine months, the S&P 500 Index[iii]was flat on an equal-weighted basis relative to the 13.1% total return reported. While large-cap concentration risk has been broadly discussed, the negative influence of rising rates on smaller-cap companies may have been overlooked.
Put simply, for the average SMID company, higher rates are a headwind. Smaller companies are more dependent on bank financing. They tend to work with regional banks, and they have a higher percentage of variable—not fixed—debt on their balance sheets; smaller caps also lack the flexibility to offer corporate debt (bonds).
Today, we are reminded that while the disparity (in market caps) has continued to dramatically widen, no single metric—no matter how relevant—dictates a market pivot.
As bank lending tightens, these companies may experience a capital spending squeeze and slower growth. Keeping rates higher for longer for the average smaller-cap company simply extends these headwinds. The regional bank crisis this past spring undoubtedly threw cold water on the average smaller company that is reliant on bank capital.
At the stock level, students know that higher interest rates pressure valuation multiples as you are discounting future cash flows at a higher rate. This typically has a larger impact on growth stocks, where more of the present value is driven by the growth of future cash flows. This was the primary driver of negative equity markets in 2022, although today we believe much of the valuation impact of higher interest rates is already reflected in stock prices. This is not unique to SMID caps; it is true across all market caps. At the same time, the regional bank crisis disproportionately hit smaller stocks.
Whether the U.S. Federal Reserve (Fed) is finished raising rates or not is unclear, but the concept of keeping rates higher for longer is largely assumed by Wall Street through the first half of 2024.
Lastly, as a reminder, no one rings a bell at the bottom. When the market chooses to pivot from large caps is a question only of “when,” not “if” in our view. However, it’s a fool’s errand to think the market can be timed accurately. Further, relying on any one metric to signal this shift would certainly make life—and the markets—easier, but that doesn’t mean we should ignore the cumulative data that has been steadily building. If the market is a leading indicator, as most believe, it would appear prudent to raise asset allocations where one observes the most attractive risk/reward in anticipation of reported fundamentals.
As bottom-up fundamental investors, our primary interest centers around earnings, earnings expectations, and earnings revisions that occur over time.
The Case for Supporting SMID Caps Today
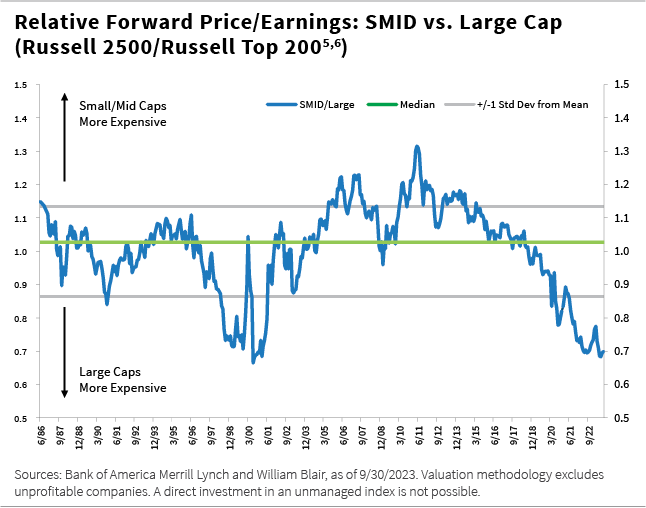
Nearly two years ago, we highlighted smaller-cap valuations as looking “exceptionally appealing” and reiterated those comments as valuation spreads with large caps widened further since January 2023. Today, we are reminded that while the disparity has continued to dramatically widen, no single metric—no matter how relevant—dictates a market pivot.
As we are often reminded, asset classes can remain undervalued for years. Still, we offer two updated charts through September 30, 2023, below: absolute and relative valuation when measured over the last 37 years. The message is, if nothing else, consistent: Whether you look at the Russell 2000[iv]and Russell 2500[v]Indices from an absolute or relative perspective, their valuations are materially below their long-term median. This is not the case for the Russell Top 200[vi]Index. The same applies to the relative valuation of SMID versus large. Today, this relative metric sits at a generational low.
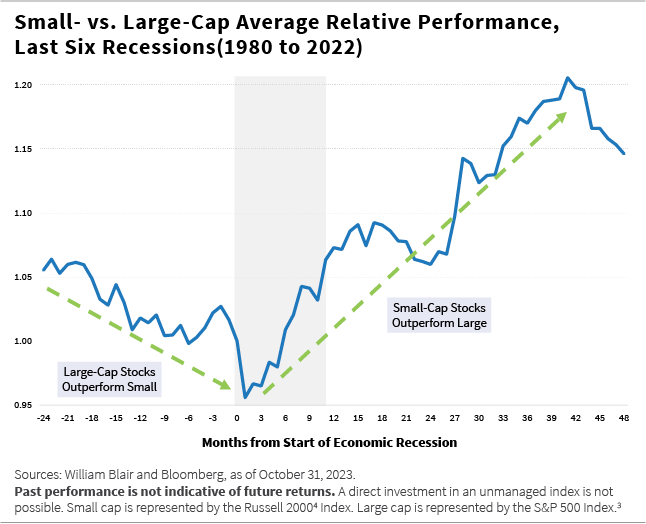
Market behavior can be radically influenced by economic changes as well as Fed actions, as shown in the chart below, which depicts smaller-cap companies’ performance going into a recession, as well as in the subsequent years, for the last six U.S. recessions going back to 1980. In five of the last six recessions, in the 24 months prior to the recession, large caps outperformed small caps. (The one exception was in 1999-2000, where small caps jumped ahead prior to the officially declared recession of 2000-2001).
Yet almost immediately upon entering a recession, smaller caps reversed and outperformed large caps for the next three years, without exception. We are not attempting to forecast anything, but should a recession occur, history makes a powerful case that is difficult to ignore.
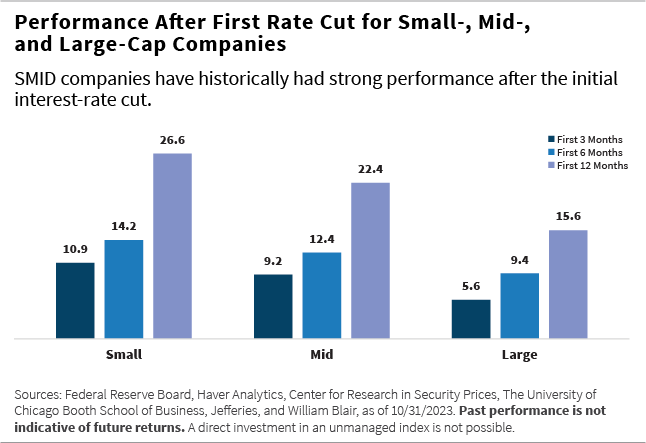
Regarding Fed actions, we show in the chart below how small-, mid-, and large-cap companies have behaved, on average, immediately following the first rate cut for the subsequent three, six, and 12 months. Note too that this data covers the period from 1954 to present.
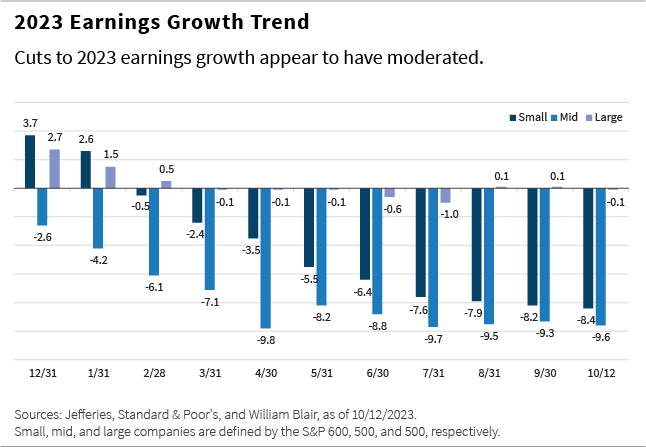
As bottom-up fundamental investors, our primary interest centers around earnings, earnings expectations, and earnings revisions that occur over time. As we observe the cuts in earnings expectations across market caps that Wall Street has made in 2023, what should be immediately apparent is that while small and mid caps have seen earnings expectations trimmed throughout the year, large caps have been remarkably stable.
Whether this suggests that larger-cap revisions have yet to come can be speculated but note in the chart below the flattening of earnings cuts in recent months for both small and mid caps. To the extent that these cuts have moderated, a clear headwind is curtailed. Our observations from our holdings’ third-quarter reporting is that our companies have generally reported in-line or better-than-expected results but maintained conservative guidance given the uncertain environment ahead.
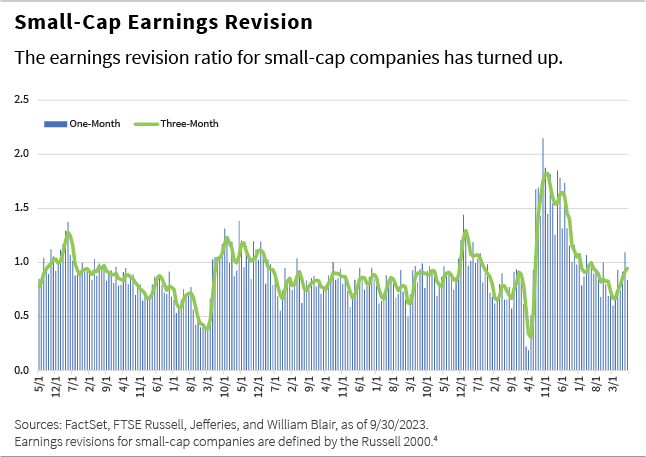
Taking this point a step further, small-cap earnings revisions, in total, have turned positive, as shown in the chart below. If one believes that earnings can move higher with earnings cuts stabilizing, we have turned a headwind into a tailwind.
The Impact of Onshoring
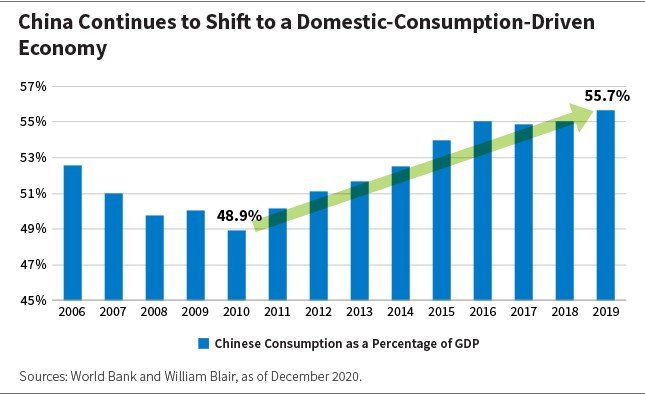
One final macro event that has been largely ignored by Wall Street is the secular impact of onshoring on U.S.-centric companies. Let’s step back: Globalization has been a life-changing movement for thousands of years, accelerating post-WWII as the U.S. and Allied Navies enforced an open global trade policy. We all know the result: manufacturing costs dropped as did consumer prices, goods selection expanded, and global economic growth ensued.
In more recent years, there has been a globalization backlash as supply chain disruptions destroyed just-in-time expectations, labor cost differentials narrowed with technology and major input disparities (including energy savings) encouraged returning production home. U.S. government tariffs and recent fiscal legislation, including the CHIPS and Science Act, Inflation Reduction Act, and Defense Production Act, are further accelerants.
Smaller companies often have the flexibility to adapt and respond to local needs more quickly.
At the time of this writing, it appears that the Panama Canal, which transports 7% of all global seaborne trade, will be limiting activity by more than 50% due to drought. While there will likely be cyclical swings, we believe the secular trend of U.S. onshoring is indisputable and will play out over many years.
What onshoring means for smaller-cap U.S. companies specifically is meaningful. These local companies are in a superior position to address the capital spending that includes not just building the factory itself, but the often materially higher spend associated with the infrastructure necessary to support it—think roads, schools, restaurants, and services broadly. Smaller companies often have the flexibility to adapt and respond to local needs more quickly. This is a distinctive and sustainable tailwind often overlooked by investors.
Our Edge in Small and Mid Caps
Extreme valuation differentials, historic market behavior, and earnings fundamentals should be considered in investors’ perception of small and mid caps. The variables likely to create a market shift in favor of smaller caps are building rapidly, and we believe an active manager with SMID-cap expertise is critical.
William Blair’s 88-year history is rooted in quality SMID-cap investing. It is who we are and what we do, and we believe we do it well. We aim to focus on what we know has worked well and what we believe will continue to win over time: sustained superior fundamentals combined with a valuation discipline that identifies attractive risk/reward.
While no one can accurately predict when the shift to smaller caps will occur, prudence suggests leaning into this extraordinarily skewed and unsustainable imbalance between U.S. large and small-mid-cap equities.
Rob Lanphier is a former partner and former portfolio specialist on William Blair’s U.S. growth and core equity team.
[i]The Russell 2500® Growth Index measures the performance of those Russell 2500 companies with above average price-to-book ratios and forecasted growth rates.
[ii]The Russell 1000® Growth Index consists of large-capitalization companies with above average price-to-book ratios and forecasted growth rates.
[iii]The Standard & Poor's 500 Index (S&P 500) is an index of 500 companies chosen for market size, liquidity and industry grouping, among other factors. The S&P 500 is designed to be a leading indicator of U.S. equities and is meant to reflect the risk/return characteristics of the large cap universe.
[iv]Russell 2000® Index measures the performance of the 2000 smallest companies in the Russell 3000 Index.
[v]The Russell 2500® Index measures the performance of the 2500 smallest companies in the Russell 3000 Index.
[vi]The Russell Top 200® Index measures the performance of the 200 largest companies in the Russell 1000 Index.
The Russell Midcap® Index is an index that is constructed to provide a comprehensive and unbiased barometer of the mid-cap growth market.