February 1, 2023 | U.S. Growth and Core Equity
Will Quality Small and Mid Cap Lead the Charge?

As we entered 2022, the relative case for non-large caps looked exceptionally appealing. That outlook proved reasonable, with small-mid caps performing essentially in line with the S&P 500 Index after more than a decade of relative, and sometimes dramatic, underperformance. Specifically, the Russell 2500 Index lost 18.4% while the S&P 500 Index fell 18.1% last year. Further, as we will highlight later, relative performance has not only stabilized in 2022, but there are very early indications that it may have begun reverting to its longer-term median.
What we missed in our early 2022 outlook, however, was how quality metrics would fail to materially influence performance, particularly given the dramatic absolute market decline this past year. As economies both in the United States and globally weaken with tighter monetary policies, corporate earnings are coming under greater pressure. This, in turn, has led to multiple contraction and general market volatility as investors seek “safer ground.”
Historically in such periods, quality metrics provided some measure of positive influence in navigating this market uncertainty. That didn’t happen in 2022, but neither did estimated or reported earnings decline to the extent one might have expected given the market freefall. As we will discuss below, we believe this dynamic is very likely about to significantly change in 2023 as last year’s higher rates begin impacting earnings with a lag.
Why Now?
A lot has changed in the past 12 months, but from a market perspective, the 425-basis-point (bps) pop in interest rates trumps all other market influences. We remind investors of how different this rate cycle has been relative to recent history in the chart below. Whether taking our “medicine” earlier and more aggressively influences the depth and duration of a U.S. slowdown or recession remains to be seen, but it is worth remembering that the stock market is a leading indicator by 9 to 12 months, and should the U.S. economy bottom in the next 12 to 18 months, we could witness a material turn in the market during 2023.

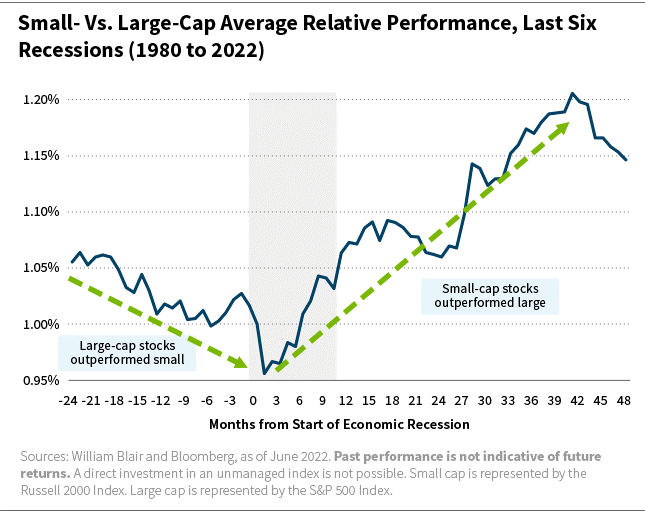
One particularly intriguing chart observes the last six U.S. recessions going back to 1980, illustrating how smaller-cap companies performed going into recessions, as well as in the subsequent years. Without exception, in the 24 months prior to a recession, large caps outperformed small caps. However, almost immediately upon entering a recession, smaller caps reversed and outperformed large caps for the next three years, again, without exception.

Another factor that has not received sufficient media and investor attention is the secular trend of on-shoring or near-shoring, that is a distinct tailwind for more U.S.-centric companies. This trend creates jobs back in the United States for companies that operate primarily in that market, a clear benefit for U.S. small-mid caps. Multinationals with significant exposure to overseas markets are more likely to face weaker end-markets in 2023 and be penalized by a relatively strong U.S. dollar.

Earnings Fundamentals
Turning to earnings fundamentals, the most recent reported quarter provides insights into the strength of earnings growth across all market caps relative to Wall Street expectations and the expectations for future growth.
Looking first at the gray bars in the chart below, we see Wall Street’s expectations ahead of the calendar third-quarter reporting season. The blue bars are the actual earnings results, and the green bars are the difference between what was expected and what was actually achieved. Note that when averaging the two green bars, the small-mid caps represent nearly five times the growth of large caps. The point: Small-mid-cap earnings are considerably stronger than expected in comparison to large caps.

Taking the fundamental differences a step further, focus first on the two bars on the right side of the chart below. Historically, when smaller caps have missed sales and earnings expectations, they have been punished more severely than large caps. But as you will note on the left side of the chart, the opposite was true in the most recently reported quarter.
The reason is straightforward: Estimates for smaller caps are already down 15% from their next-12-months’ peak while large-cap estimates have not materially moved. It therefore should not surprise investors that large caps are more vulnerable when a miss occurs as the slide portrays.

This also begs the question of “what’s embedded” in the stock from an earnings standpoint. It is one thing for Wall Street analysts to create earnings estimates, but it is far more important to know what investors are expecting and reflecting in the current stock price.
While this chart only represents one quarter, today investor expectations are lower for smaller-cap companies relative to large caps. This is also reflected in valuations, where we would argue non-large stocks should have better valuation support given the extreme divergence in relative valuations of large vs. non-large (more on this point shortly).
The last chart on earnings fundamentals below looks at Wall Street’s expectations for the next 12 months by market cap. If we combine the small- and mid-cap earnings growth estimates compared to large caps, the ratio is approximately 67% faster growth. Historically, the non-large caps have seen expected growth approximately 30% higher, suggesting Wall Street believes relative earnings growth will be above average in the non-large space. While all three market caps will likely experience deteriorating earnings expectations as we move through 2023, we can conclude that the fundamental strength and expectations of the small-mid caps appears superior to large caps today.

Valuation
Pivoting to valuation, Merrill Lynch has plotted a relative valuation below for the last 36 years, going back to 1986, for the Russell 2500 Index (U.S. small-mid caps) in comparison to the Russell Top 200 Index (a large-cap proxy). For more than a decade, large caps have dominated, leading to an unprecedented relative valuation only seen briefly during the internet bubble.
The conclusion is straightforward: There is an unmistakable and somewhat unprecedented valuation disparity that exists today between market capitalizations, which we believe favors small and mid caps. Finally, the most recent data point on this chart suggests that not only has this valuation disparity stabilized in 2022, but it has potentially begun to revert toward the long-term median.

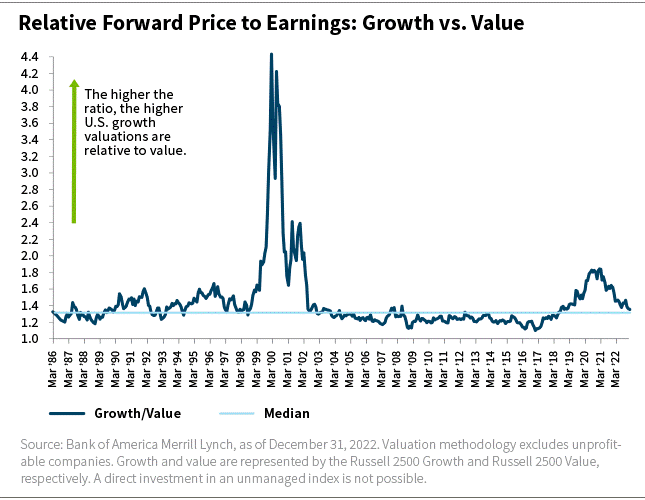
Because there is often a question of style attractiveness at any point in time, we have included the chart below, which also looks back at the last 36 years. From 2017 through 2020, Russell 2500 Growth Index valuations expanded meaningfully relative to Russell 2500 Value Index valuations, but this reversed in 2021, and today the style differences are effectively at valuation parity relative to the longer-term median. While styles can, and do, come in and out of favor, we believe investors are increasingly likely to focus on quality, whether it be in a growth, core, or value-style portfolios.

Why Quality Should Matter in 2023
As we observed early in this article, quality surprised us in 2022. One of the interesting aspects of 2022 was the apparent unwillingness of investors to recognize the potential benefits of quality as earnings begin to weaken. If one looks at the last four earnings downturns since 2000, as shown in the table below, there is a 100% correlation with positive factor performance for metrics deemed to reflect quality. In 2022, despite the initial earnings declines across all market caps, quality metrics either hurt performance or contributed a below-average contribution relative to history.

As we look forward to the rest of 2023, there are indications that higher-quality investments should fare better in the coming year. Investors expect interest rates to continue to rise, albeit at a slower pace than in 2022, assuming inflation continues to moderate. We believe the majority of multiple compression from rising interest rates should already be embedded in stocks. In contrast to 2022, we believe market performance in 2023 will likely be tied more closely to fundamentals than valuation differences.
Given the lagged impact, the effects of interest-rate increases will likely have a more meaningful impact on the U.S. economy in 2023. A slowing economy and generally weaker demand relative to this past year may necessitate that costs come into equilibrium with slower revenue growth. This implies risk to corporate earnings. Moreover, as an era of near-zero rates ends, capital sources for more speculative equities are likely to diminish, focusing more on near-term fundamentals.
We believe quality companies, which have the financial independence to continue to invest in their operations and the business model flexibility to adjust quickly in a dynamic environment, have become increasingly attractive investment opportunities against this backdrop.
Pricing flexibility, for example, will be critical if inflationary pressures from labor and materials persist and overall demand weakens. This scenario would likely cause pressure on margins and earnings disappointments for the average company. Companies with strong management teams, superior business models. and solid financials would likely be in a better position to navigate such headwinds.
In addition, higher-quality investments did not materially outperform during the sell-off in 2022, resulting in compelling valuations for these businesses as we look ahead.
William Blair Small- and Mid-Cap Expertise
If you conclude, as we do, that the small-mid-cap asset class is extremely attractive, we believe an active manager with small-mid-cap expertise is critical. William Blair’s 86-year history is rooted in quality small-mid-cap investing. It is who we are and what we do, and we do it well.
We focus on what we know has worked well and what we believe will continue to work well over time: sustained superior fundamentals combined with a valuation discipline that seeks to identify attractive risk/rewards.
Rob Lanphier is a former partner and former portfolio specialist on William Blair’s U.S. growth and core equity team.
The Russell 2000 Index is a market capitalization-weighted index designed to represent the small cap segment of the U.S. equity universe. The Russell 2500 Index is a market capitalization-weighted index designed to represent the small to mid-cap segment of the U.S. equity universe. The Russell 2500 Growth Index measures the performance of those Russell 2500 companies with above average price-to-book ratios and forecasted growth rates. The Russell 2500 Value Index measures the performance of those Russell 2500 companies with lower price-to-book ratios and forecasted growth rates. The Russell Top 200 Index is a market capitalization- weighted index designed to represent the largest cap segment of the U.S. equity universe. The S&P 5oo Index is widely regarded as the best single gauge of large-cap U.S. equities. The S&P SmallCap 600 Index seeks to measure the small-cap segment of the U.S. equity market. The S&P MidCap 400 Index provides investors with a benchmark for mid-sized companies. The S&P 1000 Index combines the S&P SmallCap 600 and S&P MidCap 400 to form a benchmark for the mid- to small-cap segment of the U.S. equity market. Indices are unmanaged and do not incur fees or expenses. It is not possible to directly invest in an unmanaged index.
